It was a record year at the Port of Los Angeles:
Cargo volumes at the Port of Los Angeles reached 8,856,782 Twenty-Foot Equivalent Units in 2016, marking the busiest year ever for a Western Hemisphere Port. The previous record was set in 2006, when the Port of Los Angeles handled 8,469,853 TEUs.
Attributed to the success is cited as understanding:
…”the importance of innovating and collaborating to move our economy forward,” said Mayor Eric Garcetti. “We have seen incredible progress over the last two years, and it speaks to the hard work and partnership between the City, business leaders, and the workers who keep our port running smoothly every day.”
The Port finished the year strong, with December volumes of 796,536 TEUs, a 27 percent increase compared to the same period last year. It was the Port’s busiest December and fourth quarter in its 110-year history. Overall in 2016, cargo increased 8.5 percent compared to 2015.
The end of the calendar year 2016 showed the following shipment activity:

To put this milestone into perspective, look at the same time span filtered to total containers only (this illustrates the long crawl forward since the mid-2000s): 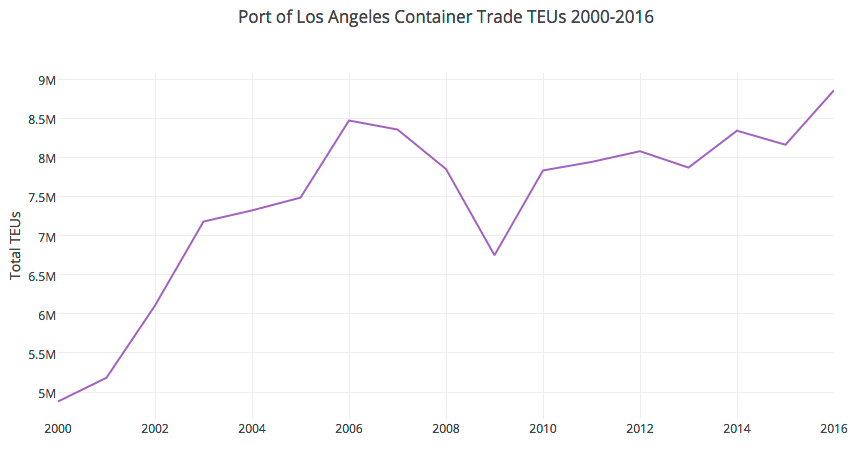
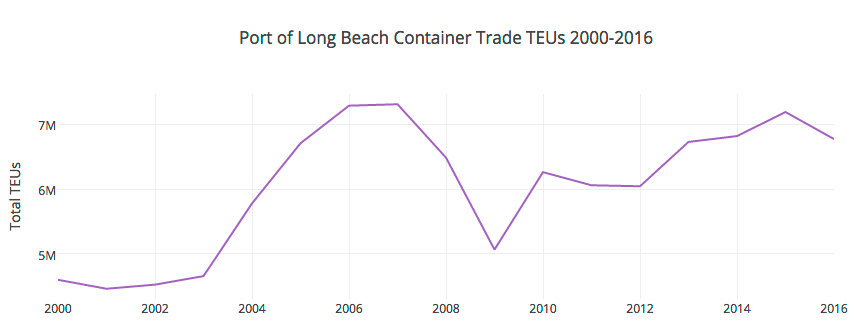
The Port of Long Beach had a little different year, but still posted strong results in spite of challenges:
Slowed by industry headwinds and challenges that included a major customer declaring bankruptcy, the Port of Long Beach still moved almost 6.8 million containers in 2016, its fifth best year ever.
Overall cargo declined 5.8 percent in 2016 compared to 2015, as the Port was impacted by new ocean carrier alliances and the August bankruptcy of Hanjin Shipping, a South Korean company and former majority stakeholder at the 381-acre Pier T container terminal — Long Beach’s largest.
By year’s end, the Harbor Commission had approved an agreement for a subsidiary of Mediterranean Shipping Co., one of the world’s largest container ship operators, to take sole control of the long-term lease at Pier T.
…“Last year was turbulent, with numerous ocean carrier mergers and other changes,” said Harbor Commission President Lori Ann Guzmán. “Now we have one of the largest ocean carriers in the world as a major partner and we’re well positioned to rebound in 2017. While the industry strives for equilibrium, Long Beach will continue be a reliable port of entry and continue to provide the fastest, most efficient services for trade from the Far East.”

Again, the change in volume since the mid-2000s is even more felt when viewing total containers only: