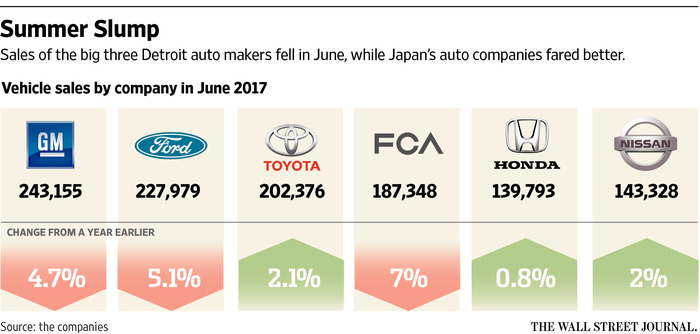
Earlier this week MotorIntelligence released its update and SAAR data. As expected, sales are somewhat reduced on a year-over-year basis:
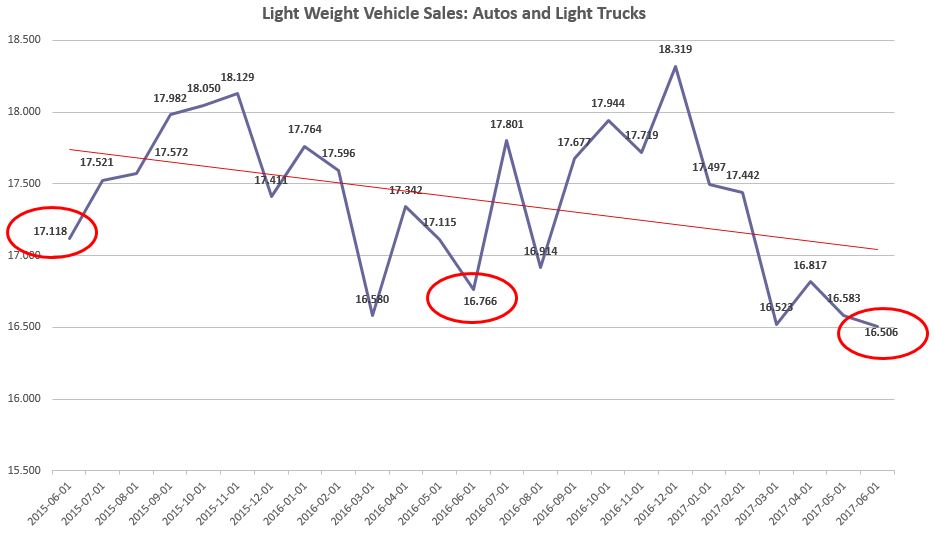
Most notably, the seasonally adjusted annual rates for autos are continuing to fall with truck sales continuing to post positive results for most manufacturers – Nissan with a whopping 21% + year-over-year truck sales with an additional 73,186 units sold over the prior year (though the company’s total car sales are off almost 12%). The Wall Street Journal cites that part of the reason for reduced sales is due to fewer vehicles being sent to rental companies:
The move away from rental sales reinforces a newfound discipline for domestic players that have been riding a seven-year growth streak since GM and Chrysler sought bankruptcy protection in 2009. The Detroit 3 reported tens of billions in profits during that span, bolstered by tailwinds from falling gas prices and surging demand for profit-rich trucks and SUVs.
Overall industry demand softened over the first half of 2017, however, falling about 2% through six months, according to JD Power. The development ushers in an expected plateau for auto sales, an important driver for the broader U.S. economy.
The fleet-sales pullback is having a disproportionate impact on wider volumes. Sales to retail customers at dealerships is down less than 1%, but sales to non-retail customers such as government fleets, commercial buyers and rental-car companies is off 7.8%, according to JD Power.
As mentioned previously, this was not unexpected given the volume of auto sales in the last three years that have extended beyond most expectations. Auto manufacturers seem to be signaling more slowdowns as the New York Times reports:
Automakers said this week that sales dropped in June for a sixth consecutive month, falling by 3 percent from a year ago, a trend that analysts do not see letting up anytime soon. And as demand falls, there is less work in the nation’s auto-assembly plants — primarily those that build traditional passenger cars…scaling back jobs in car plants is part of a newfound discipline among automakers to avoid bloated payrolls and inventories when sales start slipping.
While this trend is not all that alarming, two things are worth noting in this “post peak” period, both related to the financing of new vehicles and leases. The first is from Edmonds.com, where based on their analysis:
The average loan term for new vehicles soared to a record high of 69.3 months in June, an increase of 1 percent from June 2016 and up 6.8 percent from five years ago. In addition, the average amount financed by new-car buyers jumped to $30,945, which is a 2.6 percent increase from this time last year and 17.2 percent more than five years ago. And the average monthly car payment is now $517: That’s 2.1 percent more than in June 2016 and an 11.3 percent increase over five years.
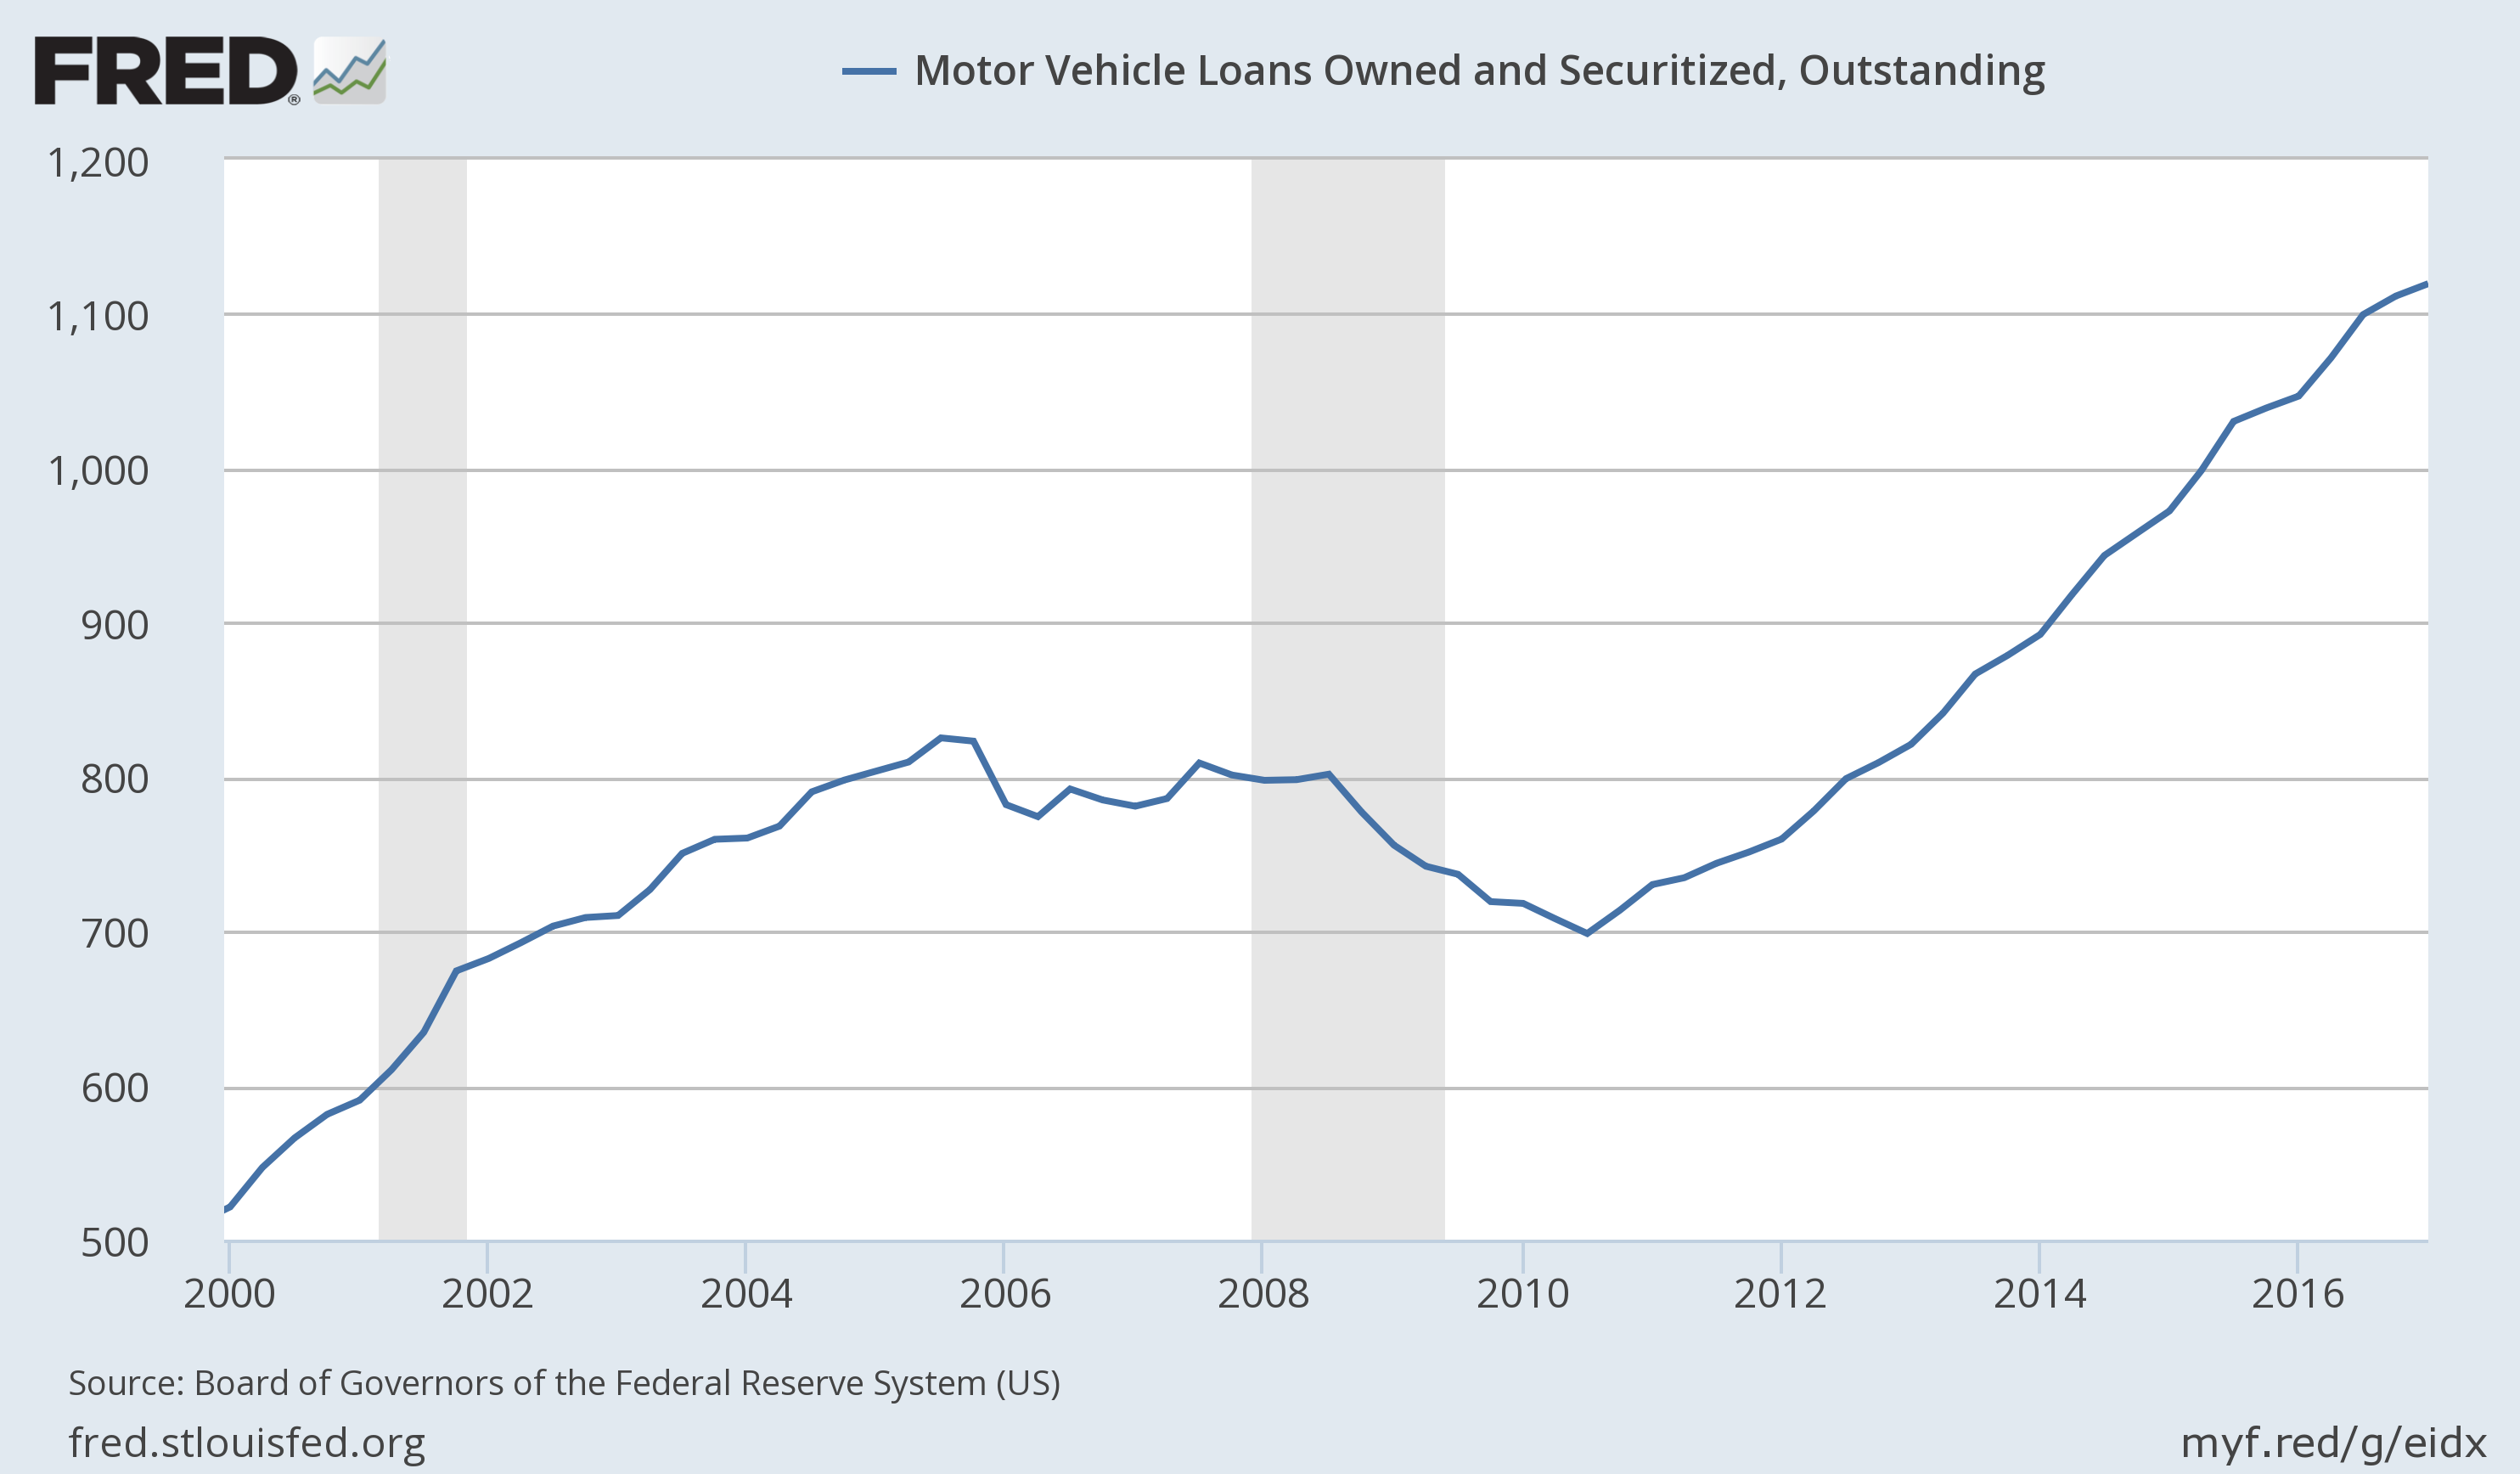
In addition, according to the St. Louis Federal Reserve, close to $400 billion has been added to securitized loans as a result of auto sales in the last five years. Unless this trend continues, it could put a dent in sales: