Consumer credit and spending momentum

Today’s Federal Reserve Consumer Credit Report (G.19) reported the following for July:

Consumer credit increased at a seasonally adjusted annual rate of 6.2 percent. Revolving credit increased at an annual rate of 11.6 percent, while nonrevolving credit increased at an annual rate of 4.4 percent. 

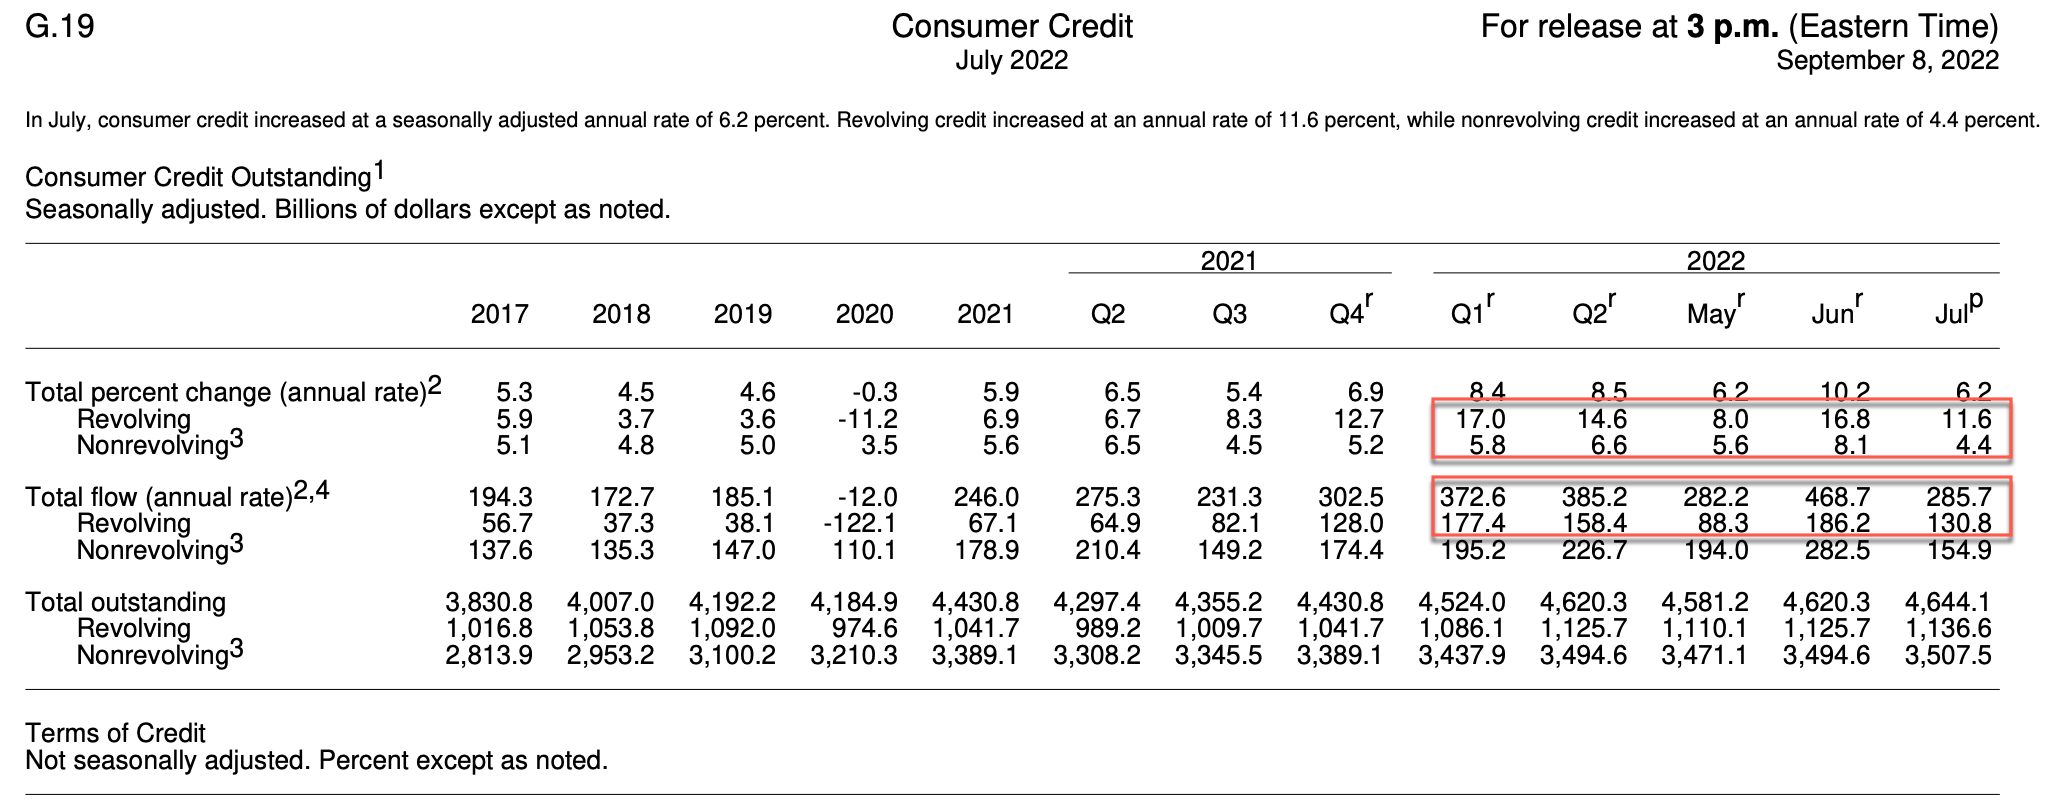
This reflects a month-over-month decrease in revolving credit from 16.8 billion to 11.6. See the full G.19 report here.

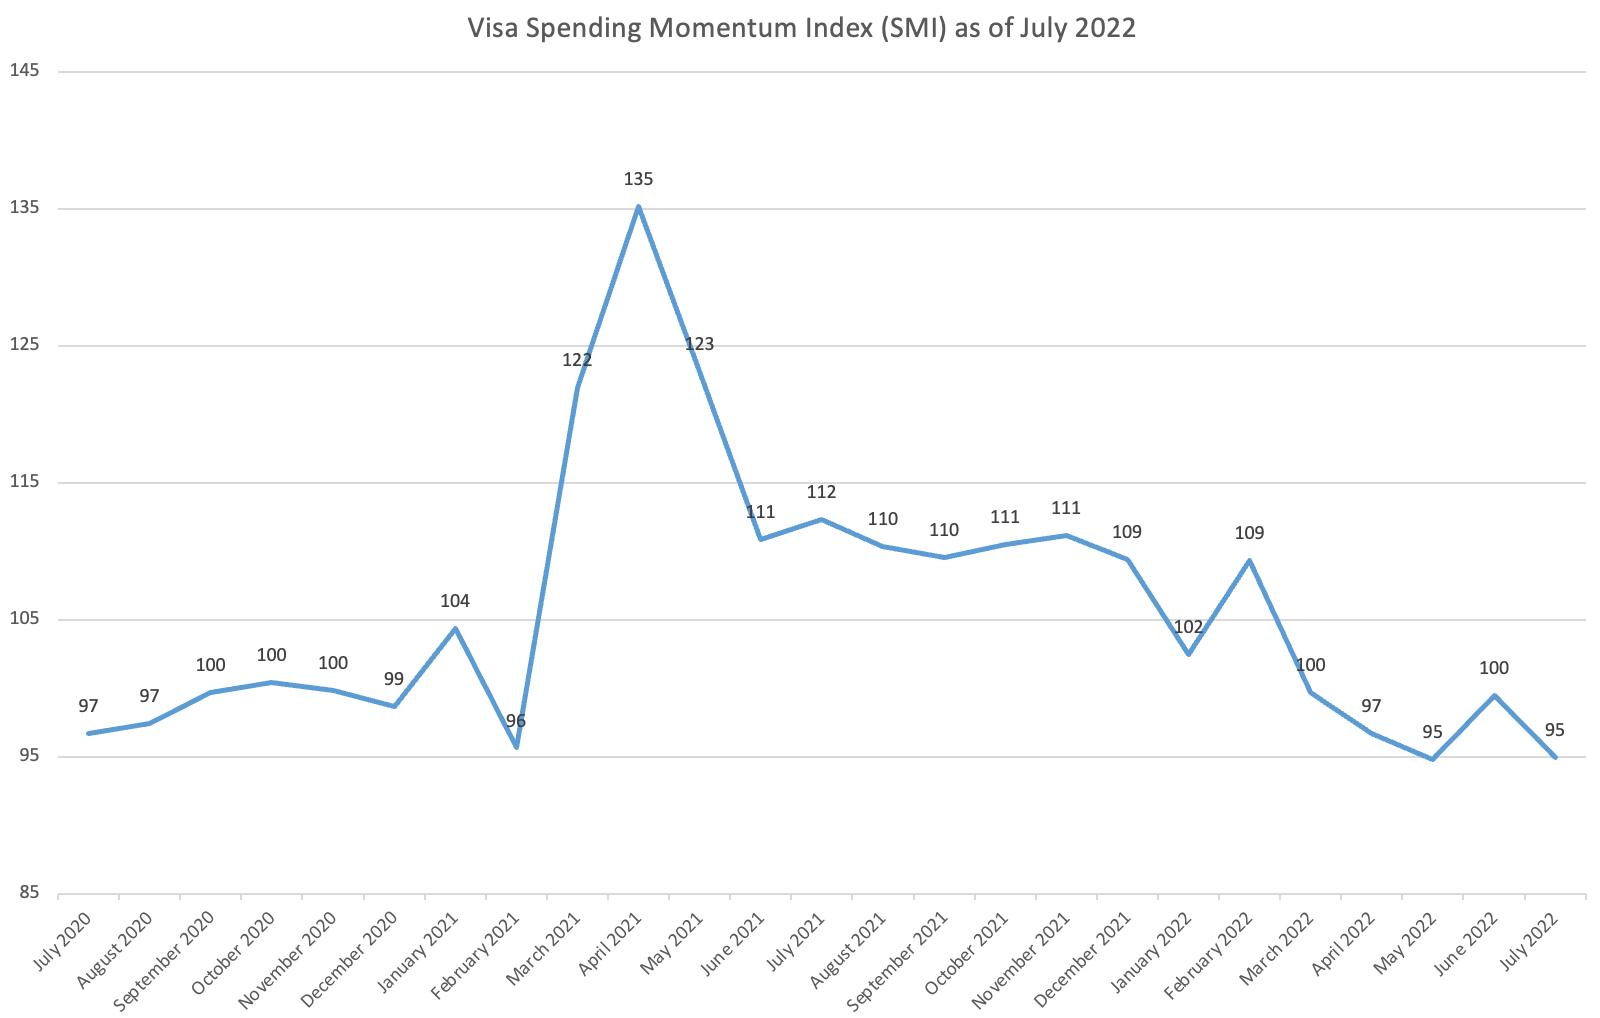
Directionally this is consistent with the most recent Visa Spending Momentum Index (SMI) which reported the following (Aug. 11):

Visa’s U.S. Spending Momentum Index (SMI) declined to 95.0 in July (seasonally adjusted), a 4.5-point deterioration from June. The SMI has now recorded a month-over-month (MoM) decline in five out of seven months in 2022 and the trend is clear: Most consumers are spending less via payment methods. All major components of the SMI declined in July—the indexes for discretionary and non-discretionary spending are both firmly below 100—indicating that spending activity is becoming concentrated among a smaller share of consumers.

FRED Blog: Declining Wage Component in GDP

Using the very simple computation, Compensation of Employees/Gross Domestic Product, FRED data shows some very interesting results over the last five decades:

Since the late 1960s, each run up in this measurement seems to be testing a high in the short run, then is followed by new declines. In some cases, sustained declines, with the last significant run up between the years of 1995-2000. The biggest question is why. The FRED Blog is the first to note that understanding this would require:

Analysis of (i) supplements to wages and salaries such as pensions and other benefits and (ii) proprietors’ income, which is earned by independent workers and business owners that compensates for labor and capital. What we are interested in is whether the decline has bottomed out.

Where are we now in this trend? Again, it is noted in the post, “that call is difficult. If you play with the graph by changing dates—for example, by ending the data in the year 2000 or 1987—you’d find a pretty similar situation in which the decline appears to have reversed.” What is also interesting is the proximity of the short-term high measurements to recessions.

FRB Atlanta GDPNow: Q2 Throttled Down Slightly

From the FRB Atlanta nowcast:

The GDPNow model forecast for real GDP growth (seasonally adjusted annual rate) in the second quarter of 2016 is 2.5 percent on May 17, down from 2.8 percent on May 13. The second-quarter forecast for real residential investment growth declined from 5.3 to 2.5 percent after this morning’s housing starts release from the U.S. Census Bureau, the forecast for real consumer spending growth ticked down from 3.7 percent to 3.6 percent after this morning’s Consumer Price Index release from the U.S. Bureau of Labor Statistics, and the forecast for the contribution of inventory investment to second-quarter growth declined from -0.24 percentage points to -0.39 percentage points after this morning’s industrial production release from the Federal Reserve. The latter decline was concentrated in motor vehicle and parts dealers’ inventories.

NOWCast 2016-05-17Get the full dataset here and report here.