First 100 days after shelter-in-place – where are we now?

Today markes the 100th day since the shelter-in-place in the northern California Bay Area, with some interesting reflections in The San Francisico Chronicle on what happened – and going forward:

Wednesday will mark 100 days since shelter-in-place orders were issued on March 17. Experts believe the move prevented thousands of deaths and tens of thousands of infections. It kept hospitals from being overrun and gave cities and counties precious time to learn about this new virus and mount a defense against it.

But more than 500 Bay Area residents died of COVID-19 in that time. More than 18,000 tested positive. And the coronavirus that drove millions of people into isolation remains as sinister and unpredictable now as it was 100 days ago. What’s changed over the past three months is not the virus, but the way the Bay Area lives with it.

…No one in public health really expected [three weeks] would be enough time to suppress the virus and let life resume as normal — but few predicted that 14 weeks later there would be no end in sight to this pandemic.

What is most remarkable is that many experts believe “the world is going to be cozy with this virus for a long while…coronavirus is still here…it’s probably far more widespread now than it was in March,”  which certainly gives pause to the last three and a half months. It is further interesting to note that the shelter orders were self described as a “draconian strike,” with profound consequences:

But understanding that their decision would have profound repercussions was not the same as watching those effects play out, said Louise Rogers, chief of San Mateo County Health.

…I didn’t really have a full understanding of how deeply impacted so many people would be, and how much it would reveal some of the deep systemic issues that already exist in society – the inequalities and the disproportionate effects.

See the full post here.

COVID-19: Ioannidis vs. Taleb (International Institute of Forecasters)

The International Institute of Forecasters facilitated a very interesting discussion in the form of two scholarly blog posts – COVID-19: Ioannidis vs. Taleb, Learning from the positions of Nassim N. Taleb and John P. Ioannidis in the COVID-19 debate. The idea of this match up of differing views from such profound thinkers is literally brilliant. The setting is what may be the closest thing we have seen of an old fashioned discourse. Pardon me for being old fashioned but actual, respectful dialogue and discourse is what is desperately needed in our present time and has been missing for decades. How much more do we need such a thing in an age where many of our national and international challenges have taken on a complexity due to the natural order of progress, technology and globalization. From the introduction page:

“Two…voices have been highly visible in the public debate, with seemingly diverging opinions. I am thinking here of John P. Ioannidis and Nassim N. Taleb (arguably two of the greatest living thinkers) holding opposing views about how to deal with the present pandemic and its potentially destructive consequences.

…Nassim N. Taleb believes that all efforts and resources should be directed to halt its spread and reduce the number of infected and deaths without any concern about forecasting its future course as the uncertainty of doing so cannot be measured and the risks involved are highly asymmetric. John P. Ioannidis, on the other hand, claims that more reliable information is needed to make multiple billion-dollar decisions and that forecasting has failed us by being too pessimistic about the future growth of the pandemic and by exaggerating its negative effects.

…This debate will not only allow us to better understand the points of view of the two great thinkers but be also left as a guide for how to deal with future pandemics.”

I would only take issue with the comment, billion-dollar decisions, since we are already well north of multi-trillion dollar decisions. Of the two positions, Taleb remains consistent with his central theme for more than a decade, namely, the profound consequences of risk versus upside benefits, and this is only amplified in pandemics, where he states they “represent existential risk.” In other words, survive now:

“Science is a procedure to update knowledge; it can be wrong provided it produces interesting discussions that lead to more discoveries…for matters that have systemic effects and/or entail survival, the asymmetry is even more pronounced.”

Ioannidis, on the other hand, has been one of the few critics of our nation and the world being put on “horror-alert,” with models that he states have:

“Failed when they used more speculation and theoretical assumptions and tried to predict long-term outcomes, e.g. using early SIR-based models to predict what would happen in the entire season.”

One note that I frequently see as both a criticism and straw man argument against Ioannidis that is worth mentioning: he is clearly not saying to do nothing, or that COVID-19 is trivial. He opens his post with the following, “COVID-19 is a major acute crisis with unpredictable consequences.” Later he and his colleagues state, “a doomsday forecast may come handy to protect civilization, when and if calamity hits. However, even then, we have little evidence that aggressive measures which focus only on few dimensions of impact actually reduce death toll and do more good than harm.” See introductory post here, Taleb here, Ioannidis here.

Epidemic Forecasting Challenge: Human Behavior

It is interesting to search and review older articles (looking for pre-COVID perspective) and realize how long we have been discussing these topics that have monopolized our current discussions in the last six months. In The Journal of Infectious Diseases, a study from 2016, Epidemic Forecasting is Messier Than Weather Forecasting: The Role of Human Behavior and Internet Data Streams in Epidemic Forecast, the authors explore the challenges of forecasting the spread of epidemics and compare and contrast with the progress of weather modeling.

The authors note in the abstract:

In the past 3 decades, the weather forecasting community has made significant advances in data collection, assimilating heterogeneous data steams into models and communicating the uncertainty of their predictions to the general public. Epidemic modelers are struggling with these same issues in forecasting the spread of emerging diseases.

Sound familiar? Here’s why, “epidemic models rely on human interactions, multiple data sources such as clinical surveillance and Internet data, and environmental or biological factors that can change the pathogen dynamics.” This reminds me of the hasty rush to a positive affirmation of test and trace (which I would not argue against) but could prove fraught with problems associated with the many and variegated variables of human behavior, requisite cooperation, and potentially unknown interactions (such as if asymptomatic superspreaders prove as accurate as is being posited). On this side point, I am not arguing against the activity of test and trace as it may be the best option we have, but the declaration of its success, given the myriad of unknowns.

The authors make a very interesting observation given what we, the entire world have experienced in the last six months, with some profound policy decisions that have been ostensibly driven by data:

Epidemic forecasting is still in its infancy and is a growing field with great potential. The challenges for accurate epidemic forecasting include data availability and emergent changes in human behavior and pathogens.

They conclude with this hopeful note which could prove prescient from four years ago, as phones and data have only increased, “there will be a parallel world, similar to that for weather forecasting, where billions of sensors will be uploading real-time information to obtain personalized disease forecasts.” Full study found here.

Census: More Centenarians – New Challenges as Well

More Centenarians Than Ever

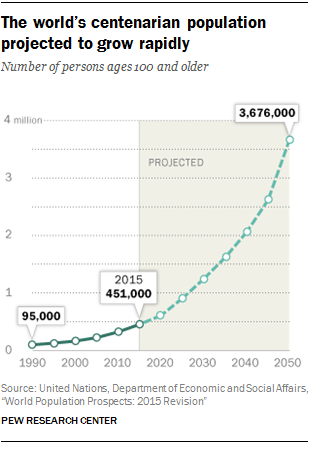
Last year, a post at the Pew Research Center included some very interesting trends in population shift and aging. In a mind-boggling projection, the total number of centenarians is expected to continue to accelerate to seven times the current number of one-half million:

Centenarian Growth Rate

The full study is found in a U.S. Census Bureau report on aging, where a subset of that report states the following regarding centenarians:

Centenarians, people 100 years or older, made up a very small portion of the total population in the 2007–2011 ACS, accounting for 55,000 people (0.02 percent). By comparison, the 65 years and over population accounted for 40 million people or 13 percent of the total population. The majority of centenarians were female (81 percent). Women were also the majority of the 65 years and over population (57 percent). This disproportionately female representation in both the 65 years and over and centenarian populations was expected, since sex differences in mortality over time contribute to higher percentages of females than males at older ages.

Want to live to 100? Then get married??

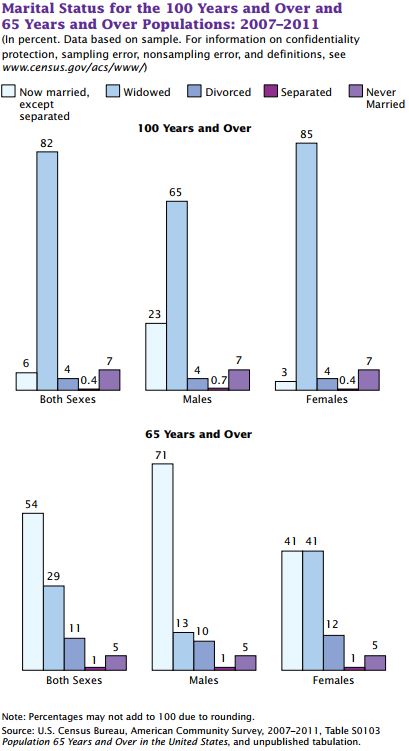
From the same report, some very interesting statistics emerge regarding marital status:

100 Marital Status

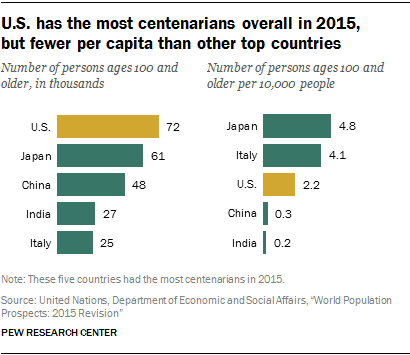
U.S. Leading the Total Count, But Fewer Per Capita

U.S. has the most centenarians overall in 2015, but fewer per capita than other top countries

What Could Possibly Go Wrong?

Aside from a number of questions for social scientists, what could possibly go wrong with living longer? (Which seems to correspond with fulfillment in life.) Life insurance caps. According to the Wall Street Journal, Happy 100th Birthday! There Goes Your Life Insurance, life insurance policies carry “a standard feature that…calls for the termination of the death benefit and payout of all of the built-up savings when the policyholder reaches the specified age.” This is an interesting challenge as it was simply not an issue in the fairly recent past, “the limits weren’t an issue in the many decades when very few people lived beyond 100. But they increasingly are a problem for the U.S. life-insurance industry as more people become centenarians.”

See the study in brief here and the full study here a the U.S. Census Bureau.

Purchasing Power Parity GDP Per Capita – Geo-FRED Interactive Map

As with a number of measures that have recently called our traditional models into question and the way we understand economic activity, the FRED Blog suggests there may be limitations to some of the mechanisms we have used for more than seventy years:

GDP has been used as a measure of economic well-being since the 1940s: It measures the total economic output by individuals, businesses, and the government and is a tangible way to quantify the state of the economy. However, some economists have questioned how well GDP measures well-being: For example, GDP fails to account for the quality of goods and services, the depletion of natural resources, and unpaid jobs that are nevertheless important (e.g., household chores). Although this criticism may be well founded, GDP is highly correlated with other measures of well-being, such as life expectancy at birth and the infant mortality rate, both of which capture some aspects of quality of life.

It’s a self-obviating point that developed nations would have much “higher levels of per capita GDP have, on average, higher levels of income and consumption,” or purchasing power. But other factors weigh into the question of how well off we are in terms of quality of life. Measures such as life expectancy and general health add to the discussion of well-being.

See the interactive map below for a “correlation between GDP and other measures of well-being” where GDP is “still a reasonable proxy of the overall well-being” for any given economy:

See the full FRED post here.

CEPR: Dodd-Frank’s Seventh Birthday – Will It Be Around to Celebrate Its Eighth?

CEPR economist Eileen Appelbaum gives a concise overview of some of the implications of the Dodd-Frank Act, which may not see its 8th year:

As memories of the great recession and financial crisis fade, the landmark financial reform law passed seven years ago today, in the aftermath of that economic disaster, is on the chopping block. A Republican Congress and the Republican President are intent on rolling back the provisions of the Dodd-Frank Wall Street Reform and Consumer Protection Act that have increased transparency and limited risk in our financial system. The Financial Choice Act, first introduced in Congress in 2016 by Texas Representative Jeb Hensarling, is poised for a comeback.

…Key provisions slated to be rolled back are those that kept private equity funds and hedge funds out of the shadows. In the first 30-plus years of their existence as major financial actors, private funds were able to structure themselves in ways that exempted them from the many laws designed to protect investors and enabled them to avoid regulatory scrutiny by the Securities and Exchange Commission (SEC). Dodd-Frank introduced oversight and regulation that has been a boon to investors in private equity. Now, Section 858 of the CHOICE Act proposes once again exempting private equity fund advisors from registration and reporting requirements. It states, “no investment adviser shall be subject to the registration or reporting requirements of this title with respect to the provision of investment advice relating to a private equity fund.”

See the full post here with links to peer reviewed articles and helpful background information including SEC actions.

FRED Blog: Healthcare Inflation vs. General CPI

In an interesting post from the FRED Blog, Healthy inflation? Inflation in the healthcare industry vs. general CPI, a comparison is set up between elements of the consumer price index, versus the rate of rising costs related to healthcare. The authors point out (what most of us have known for decades) that medical care has risen faster than the other components in the CPI basket:

Going back as far as the series are available, since 1948, the price of medical care has grown at an average annual rate of 5.3% while the entire basket, headline CPI, has grown at an average annual rate of 3.5%. In the past 20 years, in the regime of stable inflation, headline CPI has grown at an average annual rate of 2.2%, whereas the price level of medical care has grown at an average annual rate of 3.6%—about 70% faster.

The post continues addressing why this matters, beyond the obvious and anecdotal, namely, policy implications, impact to the average consumer, retirees and those with stagnant wages:

The implication of these two features is far reaching: It’s symptomatic of the increasing share of income the U.S. spends on medical care. Beyond macro trends, the features of these two series themselves have policy implications. Indeed, indexing government healthcare budgets to overall CPI rather than medical care prices has implications for spending in real terms. This gap could also widen during recessions, when government help may be most in demand.

This does not bode well given current policy discussions, as noted in the Wall Street Journal, “any replacement health plan that satisfied GOP conservatives was likely to be opposed by the party’s centrists, and vice versa.” See the full FRED post here.

Philadelphia Fed Forecast: Slightly Stronger vs. Three Months Ago

According to the Philadelphia Fed’s Real-Time Data Research Center, the outlook for 2017 is slightly upbeat, particularly compared to a few months back:

The U.S. economy over the next four quarters looks slightly stronger now than it did three months ago…forecasters predict real GDP will grow at an annual rate of 3.1 percent this quarter, up from the previous estimate of 2.3 percent. Quarterly growth over the following three quarters also looks improved. On an annual-average over annual-average basis, the forecasters predict real GDP will grow 2.1 percent in 2017, 2.5 percent in 2018, 2.1 percent in 2019, and 2.3 percent in 2020.

An improved outlook for the unemployment rate accompanies the outlook for growth. The forecasters predict that the unemployment rate will average 4.5 percent in the current quarter, before falling to 4.4 percent in the next two quarters, and 4.3 percent in the first two quarters of 2018. The projections for the next four quarters (and the next four years) are below those of the last survey, indicating a brighter outlook for unemployment.

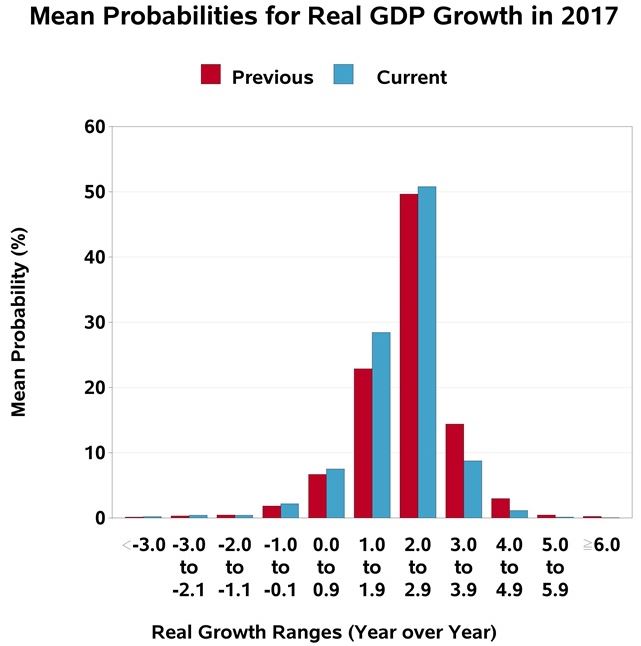
The forecasters assign the following mean probability to GDP growth rates this year:

Mean Probability

Note on Inflation

One persistent element is the inflation outlook in the coming years.  The forecasters note a downward revision:

The forecasters expect current-quarter headline CPI inflation to average 1.6 percent, lower than the last survey’s estimate of 2.3 percent. Similarly, the forecasters predict current-quarter headline PCE inflation of 1.2 percent, also lower than the 2.0 percent predicted three months ago.

Measured on a fourth-quarter over fourth-quarter basis, headline CPI inflation is expected to average about 2.3 percent in each of the next three years, little changed from the last survey. The forecasters have revised downward their projections for headline PCE inflation in 2017 to 1.8 percent, but they pegged the rates for 2018 and 2019 at 2.0 percent, unchanged from the last survey.

Over the next 10 years, 2017 to 2026, the forecasters expect headline CPI inflation to average 2.30 percent at an annual rate, unchanged from the last survey. The corresponding estimate for 10-year annual-average headline PCE inflation is 2.09 percent, little changed from the 2.10 percent predicted in the previous survey.

While not completely unexpected, this inflation forecast demonstrates an interesting shift, especially given the state of full employment. See the full writeup with lots of stats here.

Fed: One Foot on the Brake, One on the Gas

Per the Wall Street Journal, Federal Reserve Chairwoman Janet Yellen sees enough strength in the economy to continue the process of normalizing interest rates over this year and the next, after finally topping a 2.1% inflation target in February. The Fed chair reports growth, but “at a modest pace.” As such, the policy calls for action seeking a middle ground:

Where before we had our foot pressed down on the gas pedal trying to give the economy all the oomph we possibly could, now [we’re] allowing the economy to kind of coast and remain on an even keel,” she said. “To give it some gas, but not so much that we’re pressing down hard on the accelerator.”

Another interesting note is what may happen to the Fed’s $4.5 trillion portfolio:

Fed officials raised rates in March for only the third time since the financial crisis, to a range between 0.75% and 1%. But they have penciled in two more rate increases this year, followed by three in 2018. They are also considering reducing the Fed’s $4.5 trillion portfolio of cash and securities, acquired during three rounds of asset purchases aimed at lowering long-term borrowing costs after the recession.

It also seems the inflation target is going hold at 2%, which may be much more realistic in the long term, per the chair, “Evidence suggests that the population roughly expects inflation in the vicinity of 2%.”

20th Anniversary of One of the Most Iconic Expressions in Finance: Irrational Exuberance

Irrational exuberance has been one of the most iconic and recognizable phrases in the financial markets for the last twenty years – to the day. I remember this like it was yesterday, being a recent graduate and shortly after, working in the capital market. This really was the advent of an era where there has been no looking back: a tenuous and ambivalent relationship with the Fed and every nuance uttered by the Chair. Here is the full quote in its context:

Clearly, sustained low inflation implies less uncertainty about the future, and lower risk premiums imply higher prices of stocks and other earning assets. We can see that in the inverse relationship exhibited by price/earnings ratios and the rate of inflation in the past. But how do we know when irrational exuberance has unduly escalated asset values, which then become subject to unexpected and prolonged contractions as they have in Japan over the past decade? And how do we factor that assessment into monetary policy? We as central bankers need not be concerned if a collapsing financial asset bubble does not threaten to impair the real economy, its production, jobs, and price stability. Indeed, the sharp stock market break of 1987 had few negative consequences for the economy. But we should not underestimate or become complacent about the complexity of the interactions of asset markets and the economy. Thus, evaluating shifts in balance sheets generally, and in asset prices particularly, must be an integral part of the development of monetary policy.

Read the full speech from the minutes here.

Interestingly enough, here is some commentary in our present time declaring, “rationally exuberant,” (caveat emptor on long positions if you ask me):

Not everyone is convinced of this view to be sure:

In recent years the Fed has only doubled down on these policies by directly pursuing a “wealth effect.” Rather than give a boost to the broad economy, however, these central bankers have only accomplished an even greater and more pervasive financial asset perversion. Stocks, bonds and real estate have all become as overvalued as we have ever seen any one of them individually in this country. The end result of all of this money printing and interest rate manipulation is the worst economic expansion since the Great Depression and the greatest wealth inequality since that period, as well.

See the full post here.

Fed Chairwoman: Trying to Build Consensus Among Disparate Views on Policy

Even with all the discussion of the implications of China’s Move to Devalue the Yuan, it has been widely accepted that a policy of firming easy money would probably still move forward. But this could prove more challenging for the Fed given the variegated opinions among policy makers:

Officials have signaled for months they intend to start raising short-term rates from near-zero interest before year-end. But they have provided no clear sign of having settled on whether to move at their next policy meeting Sept. 16-17. Minutes of their July 28-29 meeting, released Wednesday, underscored why the decision remains a close call.

“Most [officials] judged that the conditions for policy firming had not yet been achieved, but they noted that conditions were approaching that point,” the minutes said.

That passage might be read as a hint that officials saw a September rate increase in the cards, but the minutes showed officials had wide-ranging views about taking that step and several notable sources of trepidation.

The Fed has said it won’t move rates until it is more confident inflation will rise toward its 2% target after running below it for more than three years. “Some participants expressed the view that the incoming information had not yet provided grounds for reasonable confidence that inflation would move back to 2 percent over the medium term,” the minutes said.

The conundrum is self obviating: move too fast, and you are going to tank this forward moving, but tepid recovery. Do nothing, and you might have fueled yet another bubble. And there are voices calling for action citing the need for credibility, confidence and timing, others, for caution:

Other developments are giving Fed officials new reason for caution. At the July meeting they noted China’s stock-market declines; since then Chinese officials have allowed their currency to depreciate, a new source of concern about the growth outlook in the world’s second largest economy.

U.S. crude oil prices hit a six-year low Wednesday and U.S. stocks tumbled, boosting demand for ultrasafe U.S. government debt. The yield on the benchmark 10-year Treasury note fell to 2.129% from 2.196% on Tuesday and marks the yield’s lowest closing level since May 29. A gauge of 10-year inflation expectations in the bond market fell to the lowest level since January.

So back to the conundrum. Wait and by implication, call into question the health of the U.S. economy, or move forward and see if the economy “would be able to absorb higher interest rates and that inflation was moving toward the committee’s objective.” That’s life in the big chair.

WSJ: A yuan for your thoughts, Janet?

Last week saw a whole array of opinions, outrage (misguided, genuine or contrived) and interminable commentary on the implications of China’s actions earlier last week while still maintaining the status of [just shy of] currency manipulators by the U.S. executive branch. Earlier this week in the Journal, China Moves to Devalue Yuan:

China’s yuan has been on an upward track for a decade, during which the country’s economy grew to be the second largest in the world and the currency gained importance globally. The devaluation Tuesday was the most significant downward adjustment to the yuan since 1994, when as part of a break from Communist state planning, Beijing let the currency fall by one-third.

China sets a midpoint for the value of the yuan against the U.S. dollar. In daily trading, the yuan is allowed to move 2% above or below that midpoint, which is called the daily fixing. But the central bank sometimes ignores the daily moves, at times setting the fixing so that the yuan is stronger against the dollar a day after the market has indicated it should be weaker.

With Tuesday’s move, the fixing will now be based on how the yuan closes in the previous trading session. As a result, the yuan’s fixing was weakened by 1.9% Tuesday from the previous day, leaving it at 6.2298 to the U.S. dollar, compared with 6.1162 on Monday. The yuan dropped as much as 1.99% from its previous close to 6.3360 against the dollar in Shanghai and fell as much as 2.3% in Hong Kong in early trading.

Ironically, this move was ostensibly to allow the market to play a greater role in the value of China’s currency. But contra to this view:

“The real proof in whether this change is about reform or growth will come when authorities resist the urge to intervene down the road when another policy goal that could be achieved by a significant revaluation or devaluation comes knocking,” said Scott Kennedy, an analyst at the Center for Strategic & International Studies, a Washington think tank.

“China wasn’t able to resist that urge on the stock market, so the government doesn’t get the benefit of the doubt on this quite yet,” Mr. Kennedy said, a reference to China’s recent moves to prevent further declines in its equities markets.

What about Inflation?

In an opinion post, Rate Watchers Read the Chinese Tea Leaves, the authors makes an interesting point regard another variable that could complicate matters:

Speaking before and after the step, respectively, Atlanta and New York Federal Reserve Bank presidents Dennis Lockhart and William Dudley cast doubt on the notion that run-of-the mill macroeconomic turbulence would delay a September increase. And a survey of 60 economists by The Wall Street Journal conducted mostly before China’s bombshell showed that 82% expected an increase next month.

But what about its effect, at the margin, on a critical set of U.S. economic data? Namely, inflation. Friday’s producer-price index and Wednesday’s consumer-price index will be the penultimate readings before the big decision.

…With markets recovering somewhat from the shock, China’s move probably won’t delay a September hike. But its contribution to slower price gains overall could slow the pace of Fed tightening.

 See more analysis here: