Californians population declined for the first year since 1900

From the DOF:

California’s population dipped by 182,083 residents last year, bringing the state’s total to 39,466,855 people as of January 1, 2021, according to new population estimates and housing data released today by the California Department of Finance (May, 2021).

The press release also reports that some of the decrease was attributed to excess deaths in 2020:

The COVID-19 pandemic increased California deaths in 2020 by 51,000 
average death rate for the three preceding years. “Excess deaths” rates above the past threeyear average – were observed in 51 of the state’s 58 counties. 

But the story is a mixed bag – there is significant growth in a number of inland cities, northern and southern but certainly not limited to those areas as illustrated in the interactive graphic from Cal Matters (see Cal Matters excellent write up here).

Census: More Centenarians – New Challenges as Well

More Centenarians Than Ever

Last year, a post at the Pew Research Center included some very interesting trends in population shift and aging. In a mind-boggling projection, the total number of centenarians is expected to continue to accelerate to seven times the current number of one-half million:

Centenarian Growth Rate

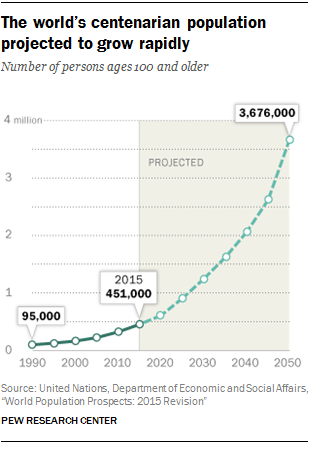
The full study is found in a U.S. Census Bureau report on aging, where a subset of that report states the following regarding centenarians:

Centenarians, people 100 years or older, made up a very small portion of the total population in the 2007–2011 ACS, accounting for 55,000 people (0.02 percent). By comparison, the 65 years and over population accounted for 40 million people or 13 percent of the total population. The majority of centenarians were female (81 percent). Women were also the majority of the 65 years and over population (57 percent). This disproportionately female representation in both the 65 years and over and centenarian populations was expected, since sex differences in mortality over time contribute to higher percentages of females than males at older ages.

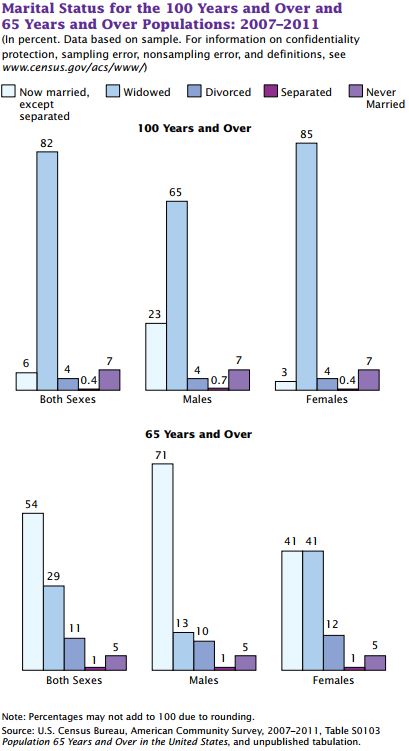
Want to live to 100? Then get married??

From the same report, some very interesting statistics emerge regarding marital status:

100 Marital Status

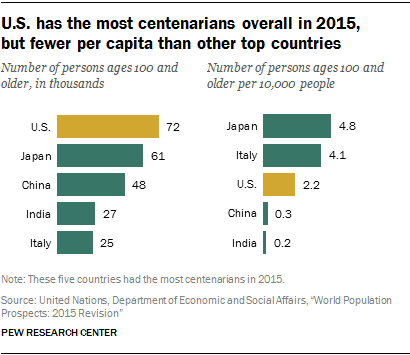
U.S. Leading the Total Count, But Fewer Per Capita

U.S. has the most centenarians overall in 2015, but fewer per capita than other top countries

What Could Possibly Go Wrong?

Aside from a number of questions for social scientists, what could possibly go wrong with living longer? (Which seems to correspond with fulfillment in life.) Life insurance caps. According to the Wall Street Journal, Happy 100th Birthday! There Goes Your Life Insurance, life insurance policies carry “a standard feature that…calls for the termination of the death benefit and payout of all of the built-up savings when the policyholder reaches the specified age.” This is an interesting challenge as it was simply not an issue in the fairly recent past, “the limits weren’t an issue in the many decades when very few people lived beyond 100. But they increasingly are a problem for the U.S. life-insurance industry as more people become centenarians.”

See the study in brief here and the full study here a the U.S. Census Bureau.

Population Shifts After Ten Years: 2002-2003 and 2012-2013

According to the U.S. Census, population shift has occurred for the following reasons:

Spurred in part by growth of the energy sector, some metropolitan and micropolitan statistical areas in North Dakota and west Texas are now experiencing rapid population gains, while growth has slowed or halted for some formerly fast-growing areas in the South and West.

What you immediately notice are the dark green shaded areas (representing 3+ percent growth), many of which that were, of course, where the height of the madness was occurring during the real estate boom. Some of these areas were the southwest states and especially California (generally anywhere east of the San Andreas Fault). As well as selected areas in southern states, and even a few high-growth inland areas that saw a tremendous ramp up during the early to mid-2000s such as Idaho.

The last ten seconds of the video shows a contra trend, practically wiping out growth area by area in the same manner that it appeared ten years prior. Corresponding to the quote above regarding the impetus for the current migration in recent years, you see 3+ percent growth in North Dakota as well as the current popularity of Texas. Another very interesting shift is from the north western, Reno area of Nevada to the north eastern area of the same state. What was driving that growth?

At the risk of sounding a bit like Pudd’nhead Wilson for pouring over such things, additional data sets and customizable maps for metropolitan and micropolitan statistical areas can be found here, the interactive map here.