Zoom CEO: “I have Zoom Fatigue”

Well over a year into this, the comments in the Wall Street Journal are sad, perplexing, and give pause to what we have done all at the same time:

After more than a year of working virtually during the pandemic, executives in banking and technology are pushing back on the idea that workers should be able to do their jobs entirely from home in the coming months. Though some said they expect more flexible work arrangements to endure going forward, they say there are clear signs of burnout in an era of nonstop video calls.

Eric Yuan, the CEO of Zoom, told a virtual audience of The Wall Street Journal’s CEO Council Summit Tuesday that he had personally experienced Zoom fatigue. On one day last year, he said he had 19 Zoom meetings in a row.

The post goes on to report that, “like many companies, Zoom is planning an eventual return to its offices,” phasing in on-site work. The inquiry really should be what is holding these firms back? Many CEOs like that of JPMorgan have observed what anyone over the age of 50 knows:

Remote work doesn’t work well for generating new ideas, preserving corporate culture and competing for clients—or “for those who want to hustle,” Mr. Dimon said, adding he has been back in the office for months. 

The technology is wonderful, and for working on specific projects that require a shared document or dataset, Zoom, Teams, et. al., work exceedingly well. But you cannot replicate the energy of face to face collaboration, and I think our culture would do well re-thinking some of what we have done over the last year. 

Updated CDC Mask Guidelines

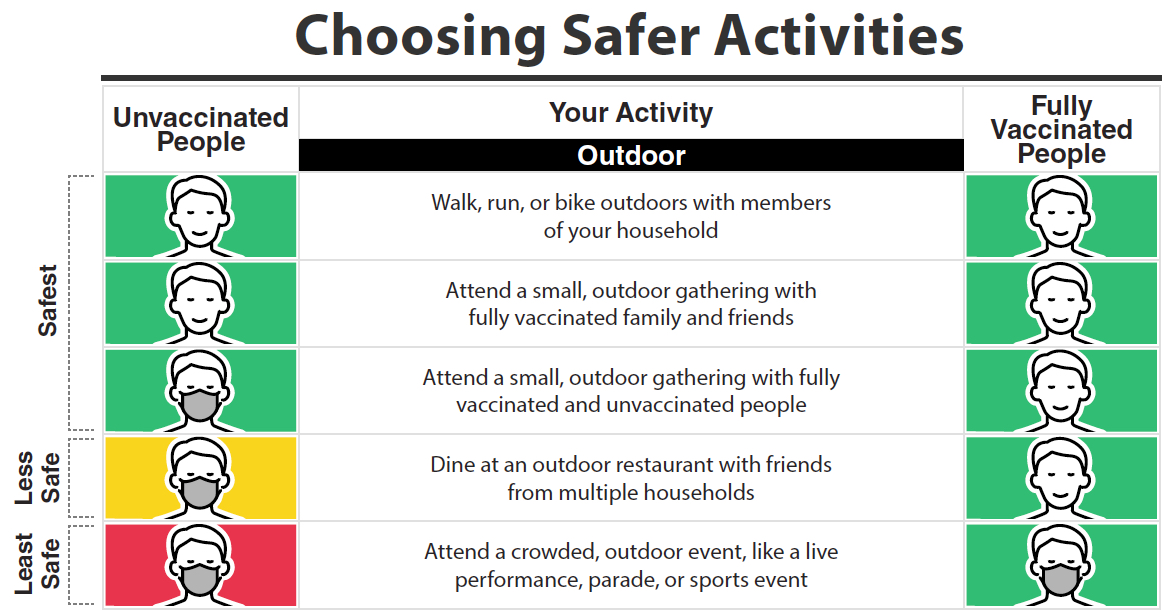
The CDC has updated its official guidelines (for April 27, 2021) on masks for those fully vaccinated (as well as a few for those who are not). The following are noted in the update:

  • Clarification that fully vaccinated workers no longer need to be restricted from work following an exposure as long as they are asymptomatic.
  • Fully vaccinated residents of non-healthcare congregate settings no longer need to quarantine following a known exposure.
  • Fully vaccinated asymptomatic people without an exposure may be exempted from routine screening testing, if feasible.

The good, better, best scenarios are shown in the partial infographic:

This is great news, but it was just four weeks prior that we read CDC Director Fears ‘Impending Doom’ and the CDC was still recommending the vaccinated to wear masks in public. I think most would not question the sincerity of such concerns or the excellent news of current progress – but what many have questioned for over a year: accuracy of what appear to be contradictory guidelines. Consider the following on the same page. A fully vaccinated people can:

  • Visit with other fully vaccinated people indoors without wearing masks or physical distancing
  • Visit with unvaccinated people (including children) from a single household who are at low risk for severe COVID-19 disease indoors without wearing masks or physical distancing
  • Refrain from testing following a known exposure, if asymptomatic, with some exceptions for specific settings
  • Refrain from quarantine following a known exposure if asymptomatic
  • Refrain from routine screening testing if asymptomatic and feasible

The Future of Self-Driving Cars – Designed Around People (132 years later)

Although the deployment of a number of technologies may have been delayed due to the pandemic, others may accelerate as a result of it. Just as the pandemic and lockdown removed the barrier (now 20 years into the 21st Century!) for paperless workflow in the office, remote meetings, remote work, education disruption, etc., others may be demanded and accepted for a number of reasons and preferences in a post-pandemic world as noted in the Wall Street Journal:

“Over the last 100 years you can’t really say the car was designed around the people; they got what space was left over”…

…As the auto industry contemplates the impact of technology—from electric cars, internet connectivity, and ultimately vehicles that drive themselves—designers are reinventing the interior of the automobile and how its passengers experience the ride. One doesn’t have to imagine some fantastic future with Jetsons-like inventions zipping around on the ground and in the air because the future is already on the drawing boards of car makers today.

What is most striking in these automobile innovations (and very consistent with the unfolding of the whole pandemic response) is the great reversal that cars now represent as a “safe space.” This of course is it due to both the inherent risk of traveling as well as the potential inconvenience of protracted wait times (or potentially getting stranded). So traveling within a large state such as California, people may simply choose to use their cars. The “oasis” concept revolves around the eventual full engagement of self-driving vehicles, technology with “head up” screens and embeded within the window, space utilization for sleeping, and ride-hailing/self-parking, all designed to prividing to create a viable and formitable competitor to air travel.

Again, what is most interesting is that these concepts are not new, but the demand may entirely shift due to the realities of a post-pandemic world. See the full WSJ post here.

WSJ: A question of purpose as many go back to work

Purpose, satisfaction, and relevance have been ongoing topics of discussion in a workplace that has changed over the last several decades but is especially felt in our present time as the Wall Street Journal points out:

Companies may have to address the angst some workers feel about their relevance and the purpose behind their jobs. Decades of research show people crave a sense of purpose to feel motivated at work. Without the coffee dates, meetings and camaraderie of time with colleagues, “you’re left with the work itself,” and if the work starts to feel wanting, it can lead to painful reckonings.

It is probably not a stretch to say that everyone has had extended, contemplative stretches of time as many (if not most) of us have had more time on our hands (even those working) than in our entire adult lives, and it would appear rotating back into the workplace is more abrupt than expected:

“Purpose” has been invoked in recent years by business leaders and employees, who say they want their careers to have meaning broader than the bottom line. Companies have embraced the term as they recruit young employees, casting their work and mission as solving important problems.

In addition to several suggestions, I would add don’t miss this unique opportunity, while it is still fresh in our minds, to contemplate why and how we are not meant to be isolated. See the full post here.

Purchasing Power Parity GDP Per Capita – Geo-FRED Interactive Map

As with a number of measures that have recently called our traditional models into question and the way we understand economic activity, the FRED Blog suggests there may be limitations to some of the mechanisms we have used for more than seventy years:

GDP has been used as a measure of economic well-being since the 1940s: It measures the total economic output by individuals, businesses, and the government and is a tangible way to quantify the state of the economy. However, some economists have questioned how well GDP measures well-being: For example, GDP fails to account for the quality of goods and services, the depletion of natural resources, and unpaid jobs that are nevertheless important (e.g., household chores). Although this criticism may be well founded, GDP is highly correlated with other measures of well-being, such as life expectancy at birth and the infant mortality rate, both of which capture some aspects of quality of life.

It’s a self-obviating point that developed nations would have much “higher levels of per capita GDP have, on average, higher levels of income and consumption,” or purchasing power. But other factors weigh into the question of how well off we are in terms of quality of life. Measures such as life expectancy and general health add to the discussion of well-being.

See the interactive map below for a “correlation between GDP and other measures of well-being” where GDP is “still a reasonable proxy of the overall well-being” for any given economy:

See the full FRED post here.

Fog of Business War Turns to the Skills Sets of Generals as Leaders

With so much emphasis on how to reach millennials and the superiority of sitting around cross-legged on the floor of an open office design, it might seem odd that high-level military experience is sought after for leadership, but should it? From the Wall Street Journal, Generals Bring Battlefield Expertise to the Business World:

In the fog of war, and in peacetime, generals are trained to anticipate unknown risks, build high-functioning teams and make quick, strategic decisions in high-pressure situations. “They are the same traits necessary in the fog of business,” says Henry Stoever, a captain in the Marine Corps who is now chief marketing officer of the National Association of Corporate Directors.

…Companies, especially those in crisis, covet the reputational boost that comes from seeking the counsel of a former military leader, says Wendy Monsen, president of executive recruiter Korn/Ferry ’s federal-government practice. Whereas more than three-quarters of Americans trust the military to act in the public’s interest, according to a 2016 Pew Research Center survey, only 41% feel the same way about business leaders.

What is surprising to learn is that the leadership styles do not reflect the command and control caricature that we might think, “Rather than barking orders and enforcing hierarchy, military leaders who succeed in the corporate world know how to coax different groups into collaborating, says retired Army Maj. Gen. Michael J. Diamond, an organizational leadership consultant.”

In other words, these backgrounds not only bring the strength of strategic vision and experience but character and leadership traits that are associated with the most effective and successful leaders, such as emotional intelligence, the ability to collaborate and getting others to cooperate. Not to mention a keen understanding of risk assessment. See the full article here.

Philadelphia Fed Forecast: Slightly Stronger vs. Three Months Ago

According to the Philadelphia Fed’s Real-Time Data Research Center, the outlook for 2017 is slightly upbeat, particularly compared to a few months back:

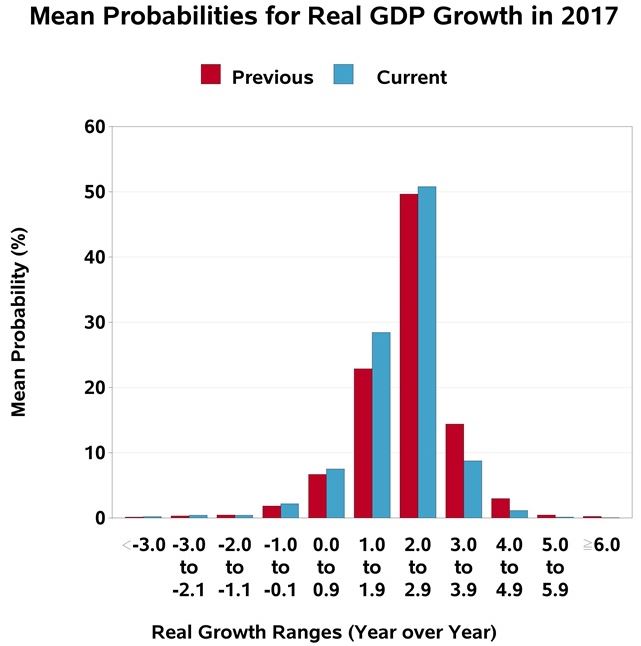
The U.S. economy over the next four quarters looks slightly stronger now than it did three months ago…forecasters predict real GDP will grow at an annual rate of 3.1 percent this quarter, up from the previous estimate of 2.3 percent. Quarterly growth over the following three quarters also looks improved. On an annual-average over annual-average basis, the forecasters predict real GDP will grow 2.1 percent in 2017, 2.5 percent in 2018, 2.1 percent in 2019, and 2.3 percent in 2020.

An improved outlook for the unemployment rate accompanies the outlook for growth. The forecasters predict that the unemployment rate will average 4.5 percent in the current quarter, before falling to 4.4 percent in the next two quarters, and 4.3 percent in the first two quarters of 2018. The projections for the next four quarters (and the next four years) are below those of the last survey, indicating a brighter outlook for unemployment.

The forecasters assign the following mean probability to GDP growth rates this year:

Mean Probability

Note on Inflation

One persistent element is the inflation outlook in the coming years.  The forecasters note a downward revision:

The forecasters expect current-quarter headline CPI inflation to average 1.6 percent, lower than the last survey’s estimate of 2.3 percent. Similarly, the forecasters predict current-quarter headline PCE inflation of 1.2 percent, also lower than the 2.0 percent predicted three months ago.

Measured on a fourth-quarter over fourth-quarter basis, headline CPI inflation is expected to average about 2.3 percent in each of the next three years, little changed from the last survey. The forecasters have revised downward their projections for headline PCE inflation in 2017 to 1.8 percent, but they pegged the rates for 2018 and 2019 at 2.0 percent, unchanged from the last survey.

Over the next 10 years, 2017 to 2026, the forecasters expect headline CPI inflation to average 2.30 percent at an annual rate, unchanged from the last survey. The corresponding estimate for 10-year annual-average headline PCE inflation is 2.09 percent, little changed from the 2.10 percent predicted in the previous survey.

While not completely unexpected, this inflation forecast demonstrates an interesting shift, especially given the state of full employment. See the full writeup with lots of stats here.

Brand Value! Los Pollos Hermanos and the New Season of Better Call Saul

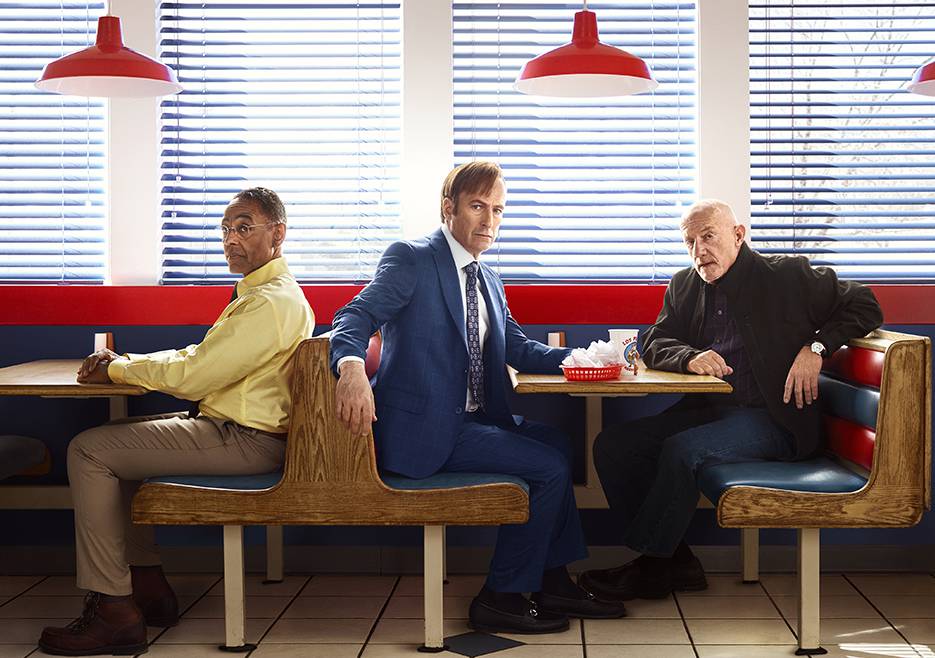
Talk about brand value! For the upcoming (and very anticipated) Season 3 of Better Call Saul, AMC promotes with a very clever tie-in to a social icon from Breaking Bad: Los Pollos Hermanos. From Forbes, “Los Pollos Hermanos was an iconic location in Breaking Bad, with the Mexican themed chicken restaurant serving as the front for Fring’s meth empire.”

From the AMC site:

This imminent existential threat presses Jimmy’s faltering moral compass to the limit. Meanwhile, Mike searches for a mysterious adversary who seems to know almost everything about his business. As the season progresses, new characters are introduced and backstories are further illuminated with meaningful nods to the Breaking Bad universe.

Yes, the end won’t be better than the beginning but the journey is going to be excellent.

BCS

20th Anniversary of One of the Most Iconic Expressions in Finance: Irrational Exuberance

Irrational exuberance has been one of the most iconic and recognizable phrases in the financial markets for the last twenty years – to the day. I remember this like it was yesterday, being a recent graduate and shortly after, working in the capital market. This really was the advent of an era where there has been no looking back: a tenuous and ambivalent relationship with the Fed and every nuance uttered by the Chair. Here is the full quote in its context:

Clearly, sustained low inflation implies less uncertainty about the future, and lower risk premiums imply higher prices of stocks and other earning assets. We can see that in the inverse relationship exhibited by price/earnings ratios and the rate of inflation in the past. But how do we know when irrational exuberance has unduly escalated asset values, which then become subject to unexpected and prolonged contractions as they have in Japan over the past decade? And how do we factor that assessment into monetary policy? We as central bankers need not be concerned if a collapsing financial asset bubble does not threaten to impair the real economy, its production, jobs, and price stability. Indeed, the sharp stock market break of 1987 had few negative consequences for the economy. But we should not underestimate or become complacent about the complexity of the interactions of asset markets and the economy. Thus, evaluating shifts in balance sheets generally, and in asset prices particularly, must be an integral part of the development of monetary policy.

Read the full speech from the minutes here.

Interestingly enough, here is some commentary in our present time declaring, “rationally exuberant,” (caveat emptor on long positions if you ask me):

Not everyone is convinced of this view to be sure:

In recent years the Fed has only doubled down on these policies by directly pursuing a “wealth effect.” Rather than give a boost to the broad economy, however, these central bankers have only accomplished an even greater and more pervasive financial asset perversion. Stocks, bonds and real estate have all become as overvalued as we have ever seen any one of them individually in this country. The end result of all of this money printing and interest rate manipulation is the worst economic expansion since the Great Depression and the greatest wealth inequality since that period, as well.

See the full post here.

WSJ: Is Growth in the Gig Economy Stalling Out? – Flattening Growth Trend in Uber, Etsy and Airbnb

The Wall Street Journal asks, Is Growth in the Gig Economy Stalling Out? Flattening trends are seen using information from Morgan Chase & Co. related to earnings from “Uber, TaskRabbit, eBay, Airbnb and nearly 40 other sites considered part of the “gig economy.””

These new sites and platforms hold the potential to radically reshape the American workforce, leaving a growing number of employees severed from traditional payroll jobs. But just how much is that actually happening? Research has suggested that most of the rise in independent contracting has been happening outside of these high-profile online platforms. And now, the latest data from JPMorgan suggests growth in the number of active users of online platforms is slowing down.

cxunuuqwiamod3r

The report distinguishes between two types of platforms: those where users sell “capital,” whether it’s goods on eBay or Etsy or renting apartments, and those where users sell “labor,” such as Uber, Lyft, TaskRabbit and so on. They find that about 1% of adults are active on such platforms in any given month. That’s up, but only a little bit, from estimates made earlier this year. The period of explosive growth for this type of work may be over. (Only a trivial number of people use both types of platforms.)

This extraordinarily high turnover “implies that growth in online platform participation is highly dependent on attracting new participants or increasing the attachment of existing participants,” the report says. In other words, if companies in the gig economy want to keep growing, they need a strategy to stop people from quitting after a few months.

The post cites a remarkable number of adults who have participated in shared economy jobs but an extraordinarily high rate of churn from these jobs inside of a year. This actually resembles similar trends that occur during normal economic slowdowns where professionals or skilled labor temporarily take on unrelated, sometimes reasonable earning temporary work. But it appears there is a shift back to traditional jobs rather than a new trend that was going to change the world.

Residential Homeownership at More than a 50-Year Low

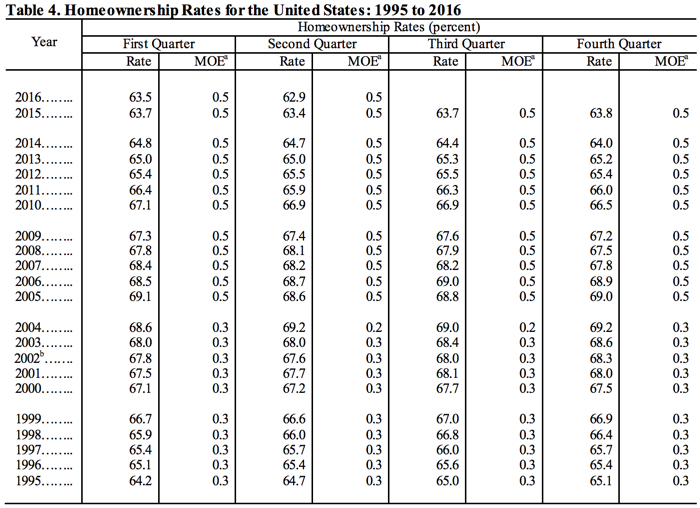
The Census Bureau updated its quarterly Housing Vacancies and Homeownership (CPS/HVS) and returned the following results:

Table 4 2016-07-28

As illustrated by the information in the table, homeownership in the U.S. continues to produce negative results as noted by the Wall Street Journal:

The U.S. homeownership rate fell to the lowest level in more than 50 years in the second quarter of 2016, a reflection of the lingering effects of the housing bust, financial hurdles to buying and shifting demographics across the country.

But the bigger picture also suggests more Americans are gaining the confidence to strike out on their own, albeit as renters rather than buyers.

The homeownership rate, the proportion of households that are owner-occupied, fell to 62.9%, half a percentage point lower than the second quarter of 2015 and 0.6 percentage point lower than the first quarter 2016, the Census Bureau said on Thursday. That was the lowest figure since 1965.

These last statistics are reflected in the interactive FRED chart below:


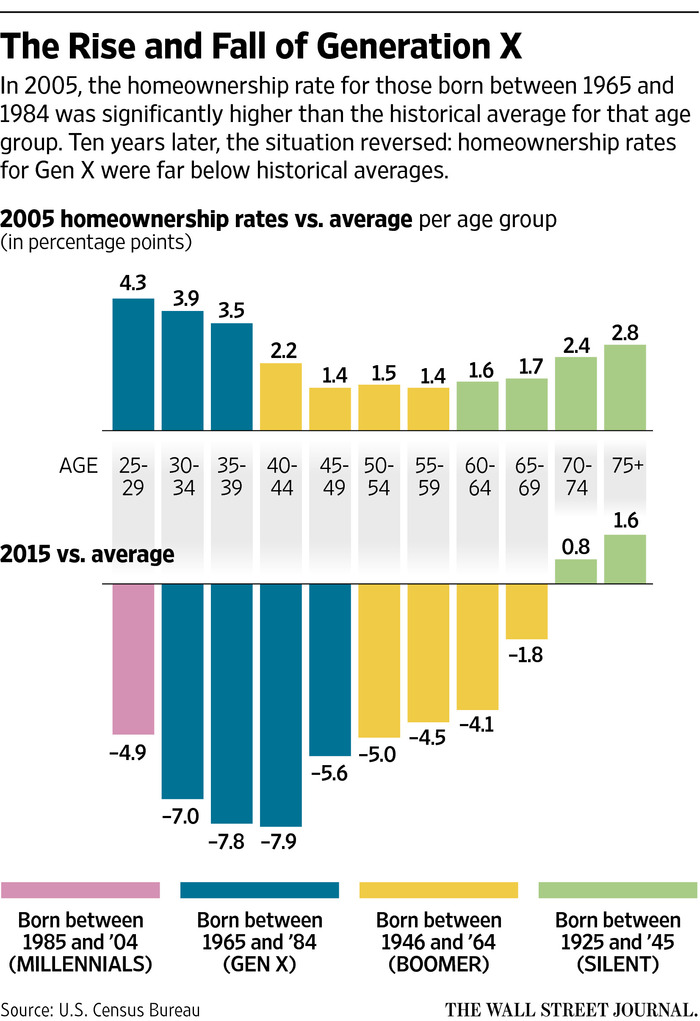
One very interesting element of the homeownership trend is the sociological shakeout among generational groups, with some results as expected, and others left for more in-depth studies:

NA-CJ738_GENX_9U_20160408150908

Source: The Wall Street Journal: http://www.wsj.com/articles/housing-bust-lingers-for-generation-x-1460142759

The full Bureau of Census report can be viewed here and the quarterly updates here.