WSJ: U.S. auto sales worst annual results in over a decade

This was a highly anticipated and material number, similar to employment as the true measurement needed to span pre-covid distortions and skewed data. The Wall Street Journal reports:

The U.S. auto industry is poised to post its worst annual sales in more than a decade, as supply-chain snarls and poorly stocked dealerships dented sales for many car companies in 2022.

…Industrywide, U.S. auto sales were projected to total 13.7 million vehicles in 2022, which would be the lowest figure in more than a decade, and an 8% decline from the prior year, according to a joint forecast by research firms J.D. Power and LMC Automotive. Sales had topped 17 million vehicles for five straight years before the Covid-19 pandemic struck in 2020, unleashing supply-chain problems that have bogged down deliveries ever since.

The commentary, “when we started the year off, the whole industry had projections all above 16 million” says it all. Continued restrictive monetary policy, clearly outlined by the Fed will further this trajectory. See the full post here.

FOMC notes and updated indicators (2022 09 21)

FOMC NOTES*

  • Fed’s third straight 75 basis-point-hike drove “a much more hawkish dot plot that showed 125 more basis points of hikes this year” (so a potential fourth 75-basis-point increase in November) and a terminal rate of 4.6%
  • Policymakers substantially revised other economic projections and now see growth at just 0.2% this year, down from the 1.7% forecast in June. They now see the unemployment rate rising to 4.4% next year and inflation not falling to 2% until 2025
  • Chair Powell, “my main message has not changed at all since Jackson Hole” (recall: “historical record cautions strongly against prematurely loosening policy”) and “our job is to deliver price stability…central bankers see that as a precursor for health in the rest of the economy”
  • Powell said growth will need to be below trend for a while, and labor markets will need to soften, but he refrained from being too forceful on the subject of economic pain. Delays in restoring price stability could bring “more pain”

OTHER INDICATORS:

  • The Bloomberg Dollar Spot Index climbed to a record high
  • The yield on 10-year Treasuries advanced 12 basis points to 3.65%
  • US Leading Economic Index (LEI) fell 0.3% in Aug., vs. est. -0.1% (six-month annualized LEI narrowed to -5.3%)
  • US asking rents rose in August by the slowest pace in a year, a sign the hot rental market could finally be cooling, according to real estate brokerage Redfin. The national median asking rent rose 11% year-over-year to a record high of $2,039
  • Mortgage rates in US advance to 6.29% – the highest since October 2008

* source for many of these notes Stifel Economics

The bottom or is this time it’s different?

A number of market analysts observe that historically, an index can retrace a very significant amount (up to two-thirds; cf. Colby) while still in a primary trend. Some interpret the Dow Theory as supporting this:

…signals that occur on one index must match or correspond with the signals on the other. If one index, such as the Dow Jones Industrial Average, is confirming a new primary uptrend, but another index remains in a primary downward trend, traders should not assume that a new trend has begun (Investopedia).

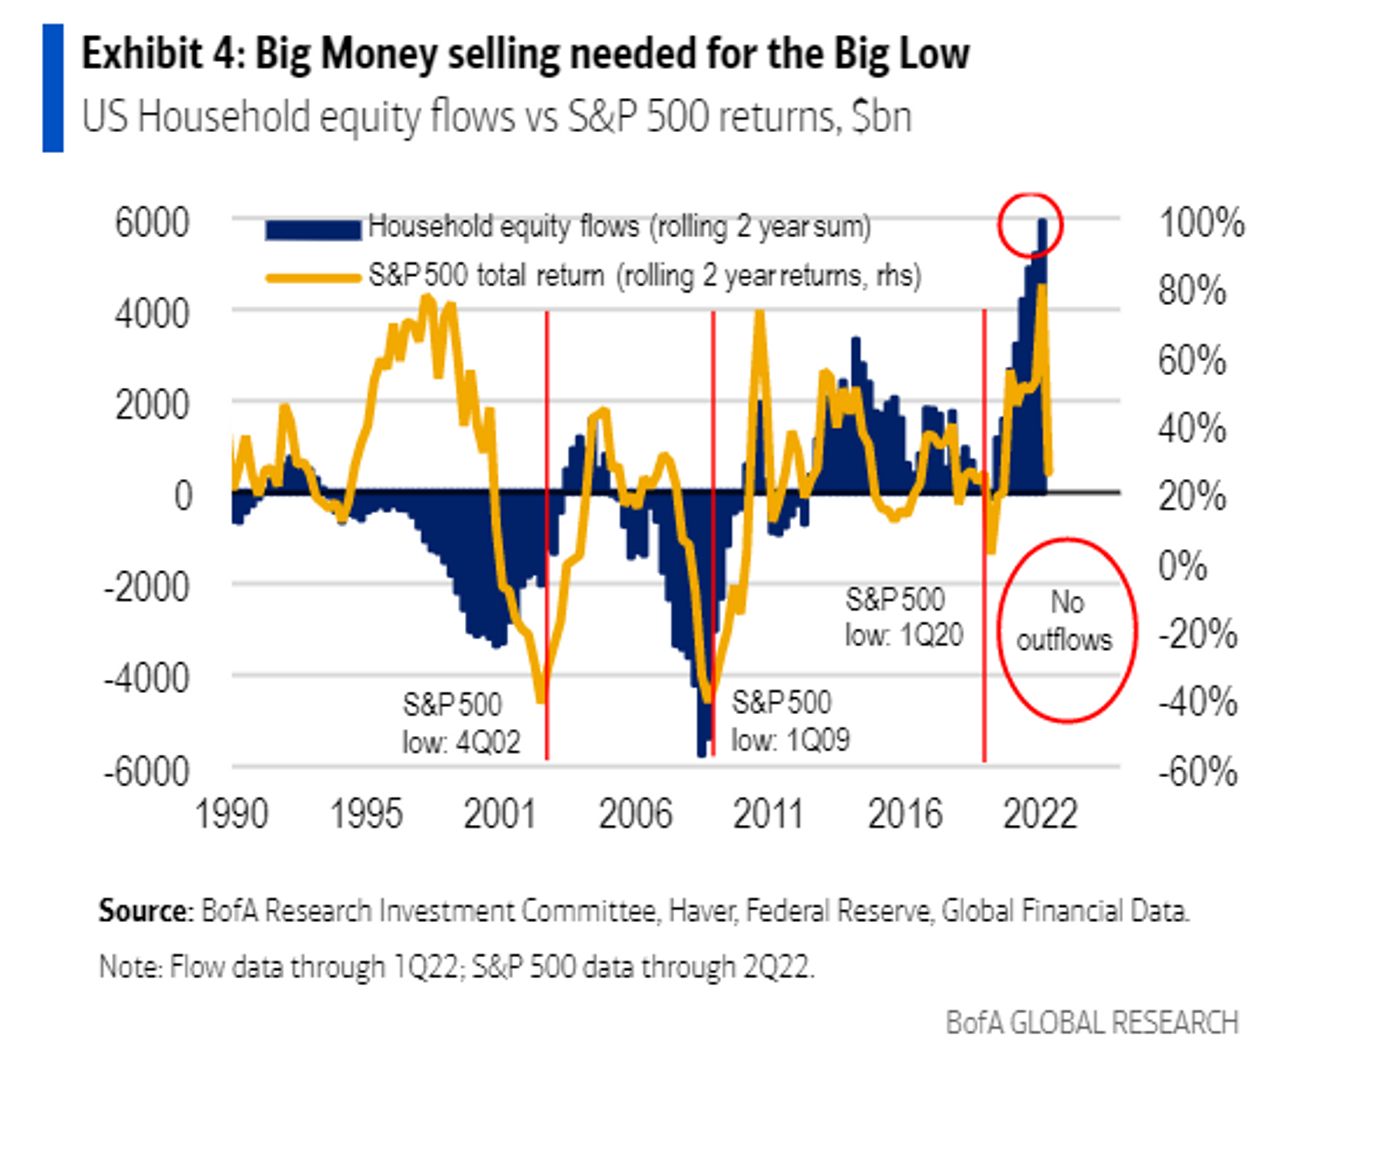
BofA Global believes this to be the case for a very specific reason: household majority position of the overall market that has not sold, yet:

U.S. households now own roughly 52% of the stock market. And a look at three major market plunges since 2000 (see chart) shows that equities only bottomed a few quarters after significant selling activity from households occurred.

BofA’s research investment team said a common refrain from July investor meetings was: “Everybody’s already bearish, might as well buy.” But they still favor cash, credit, and equities, in that order. Or at least until households, the “decision-maker,” decides to make a move and sell.

Gated article but full post access here.

Pending Home Sales Fell 8.6% in June – Year-over-year, transactions DOWN 20.0%

Excerpt from the June pending home sales report from NAR:

Homes were 80% more expensive in June 2022 than in June 2019

    • Homes were 80% more expensive in June 2022 than in June 2019
    • Pending home sales declined 8.6% from May as escalating mortgage rates and housing prices impacted potential buyers.
    • Pending sales retreated in all four major regions, with the West experiencing the largest monthly decline.
    • Compared to the previous year, contract signings dropped by double digits in each region as pending sales in the West were down by nearly a third.

“The Pending Home Sales Index (PHSI), a forward-looking indicator of home sales based on contract signings, dipped 8.6% to 91.0 in June. Year-over-year, transactions shrank 20.0%. An index of 100 is equal to the level of contract activity in 2001.”

See full report here.