The U.S. Bureau of Labor Statistics (BLS) defines marginally attached in simple, straightforward language:
Marginally attached workers
Persons not in the labor force who want and are available for work, and who have looked for a job sometime in the prior 12 months (or since the end of their last job if they held one within the past 12 months), but were not counted as unemployed because they had not searched for work in the 4 weeks preceding the survey. Discouraged workers are a subset of the marginally attached.
Discouraged workers
Persons not in the labor force who want and are available for a job and who have looked for work sometime in the past 12 months (or since the end of their last job if they held one within the past 12 months), but who are not currently looking because they believe there are no jobs available or there are none for which they would qualify.
For the purpose of illustration, the FRED graph below has the top five states selected (which accounts for more than a third of the nation’s population), showing the trend of marginally attached workers for more than a decade.
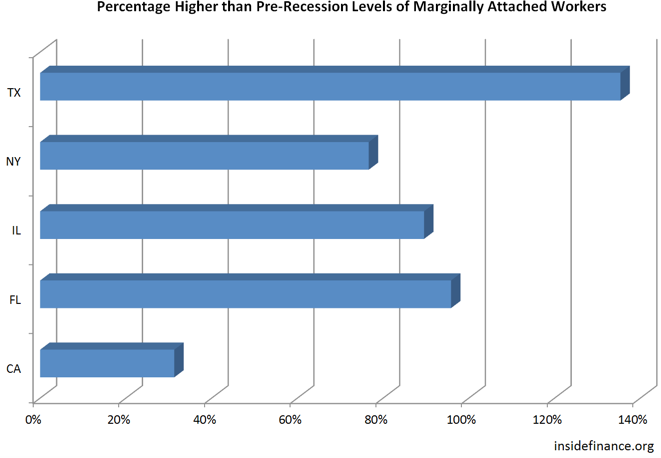
The trend lines show the inherent headwinds since the beginning of economic recovery in June 2009. The still “on the grid” numbers of the marginally attached and discouraged workers has hung on much longer than a decade ago. What’s more, six years into recovery, not one of these states has returned to its pre-recession level of the marginally attached:
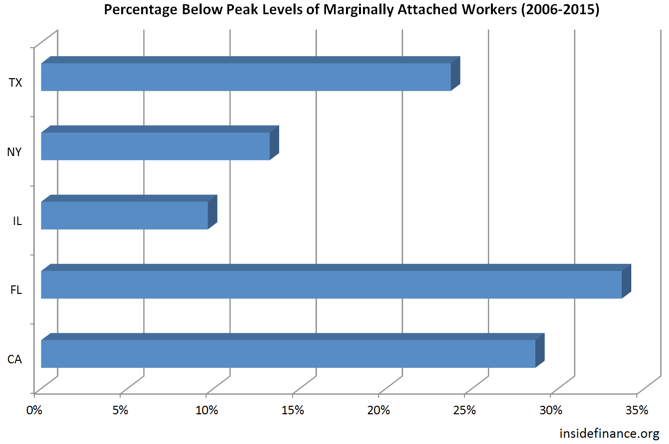
This could be due in part to an aging population as well as population shifts and growth in general. This also illustrates why for so many, the recovery has not felt like a recovery. The reality is, jobs are being added as illustrated by the decreased levels of the marginally attached from the corresponding peak levels by state (peak levels were between July 2010 and October 2011):