The ACSI Measurement Model
If you are not familiar with the American Customer Satisfaction Index (ACSI), it is a unique organization that engages in “national cross-industry measure of customer satisfaction in the United States,” as well as user satisfaction with public agencies:
This strategic economic indicator is based on customer evaluations of the quality of goods and services purchased in the United States and produced by domestic and foreign firms with substantial U.S. market shares. The ACSI measures the quality of economic output as a complement to traditional measures of the quantity of economic output.
In addition to its extensive coverage of the private sector, the American Customer Satisfaction Index (ACSI) benchmarks citizen satisfaction for a multitude of federal agencies and departments, as well as two high-usage services of local governments (police and solid waste management). In 1999, the federal government selected the ACSI to be a standard metric for measuring citizen satisfaction. Now, over a decade later, ACSI coverage of federal government continues to grow. All told, the ACSI measures citizen satisfaction with over 100 services, programs, and websites of federal government agencies.
For both government and private-sector measurement, the ACSI uses customer interviews as input to a multi-equation econometric model. Customers’ responses about a government agency are aggregated to produce its ACSI benchmark, thus results are specific to each individually measured organization. Because most agencies do not deal in economic transactions in a strict sense, the ACSI government model includes outcomes appropriate to the public sector in lieu of price-related measures.
See the full ACSI benchmarks and reports for all industries (including government) here.
Why does this matter?
The most obvious use of the ACSI econometric measurements is to provide a field poll assessment of the mood of the marketplace. It almost functions like backend support for marketers. But more interesting is the potential tie to economic activity:
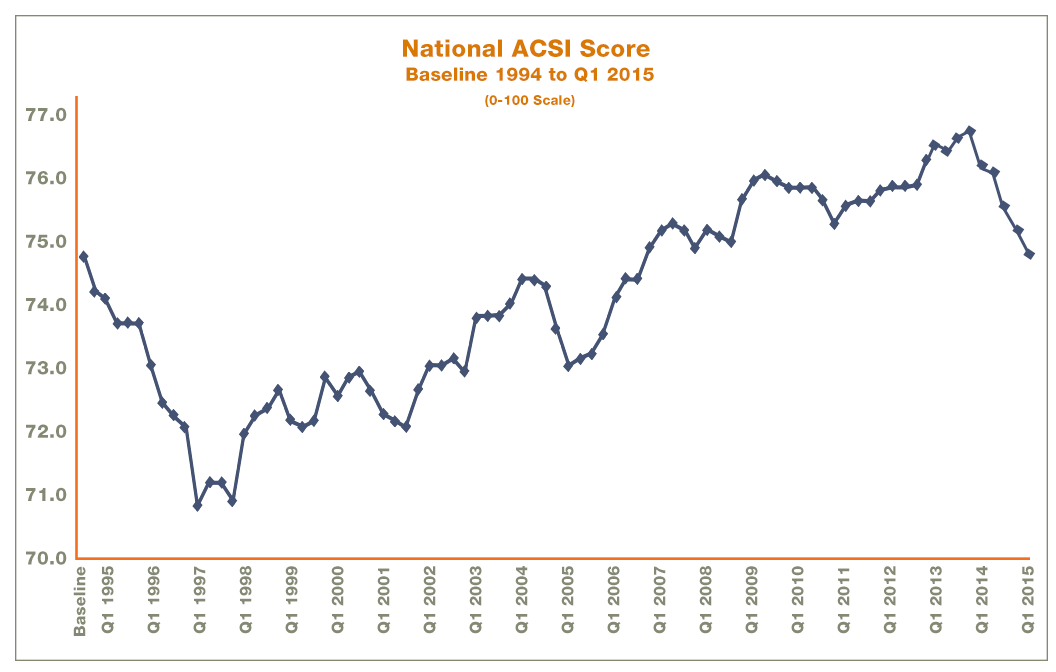
ACSI’s time-tested, scientific model provides key insights across the entire customer experience. ACSI results are strongly related to a number of essential indicators of micro and macroeconomic performance. At the micro level, companies that display high levels of customer satisfaction tend to have higher earnings and stock returns relative to competitors. At the macro level, customer satisfaction has been shown to be predictive of both consumer spending and gross domestic product growth (click image for enlarged view).
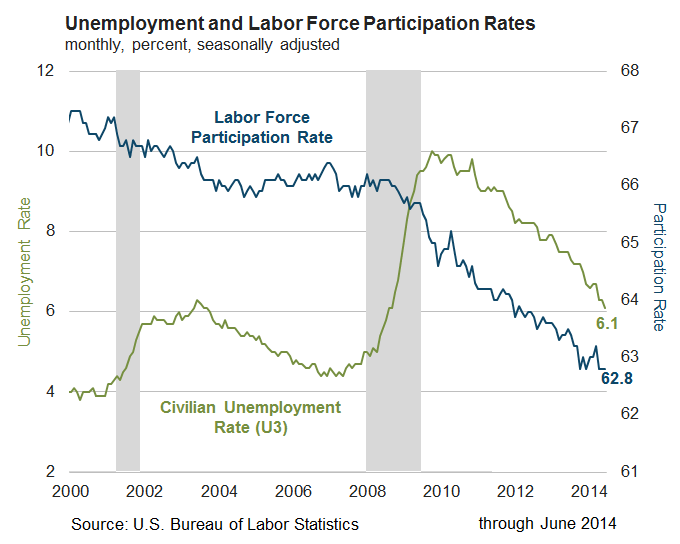
It is interesting to compare these results with a general reading of the overall economy, such as the U.S. Economy in a Snapshot by the Federal Reserve Bank of New York, where the assessment of consumer behavior is that “spending remains tepid.” This is in agreement with an article (contrarian tone) in the Investor’s Business Daily by the ACSI’s founder from earlier this year:
Despite a flurry of good economic news, the U.S. recovery, while better than just about any other country at the moment, will not gain much momentum unless there is a substantial increase in consumer demand.
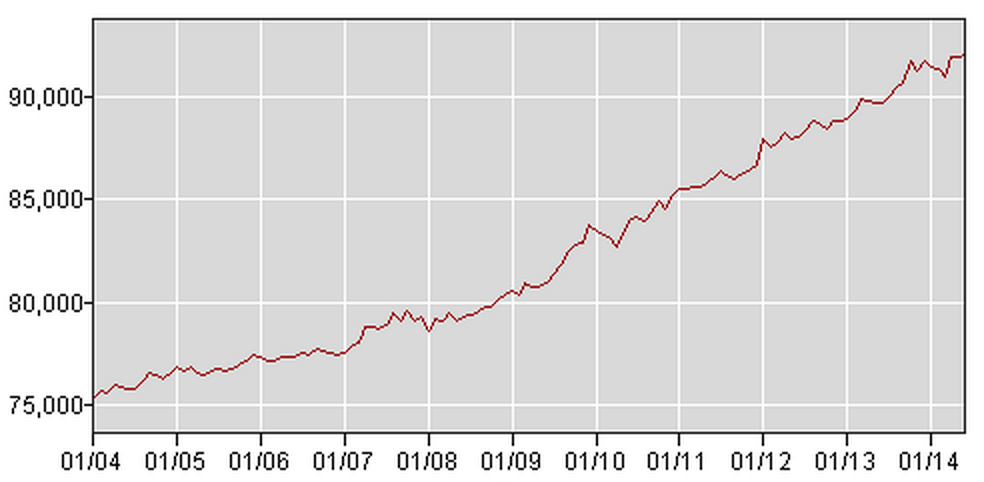
Following the February jobs report, which showed better-than-expected employment growth, many economic commentators contend the economy is poised for sizable expansion in the near future, perhaps by as much as 4% or better…But neither is likely unless consumer spending strengthens substantially. In fact, spending growth probably needs to double in order for the economy to take off.
What is particularly interesting is the correlation the IBD makes to consumer satisfaction and meager wage growth. We can understand wage growth and discretionary income, but the link to consumer satisfaction may not be as easily recognizable:
Except for nondiscretionary spending, which only increases proportionally to population growth, consumers need a reason to spend and the means to do it. Recent data from the American Customer Satisfaction Index (ACSI), which measures the quality of economic output from the perspective of the user of that output, show that customer satisfaction in the U.S. is down for a fourth consecutive quarter.
It is not that consumer standards or expectations are now higher somehow. Rather, consumers are finding the shopping and consumption experience less satisfying. Too many companies have been unable to create a satisfied customer, which, according to the late Peter Drucker, is the fundamental purpose of business.
The article concludes, from a different perspective that until there is pent up consumer demand, the modest gains (at best) are what will continue.


