Consumer Price Index – Inflation as Expected

As expected, the CPI news release (April 2021) today shows significant inflation, as that has been the anecdote from almost everywhere. The surprise is just how much and how fast:

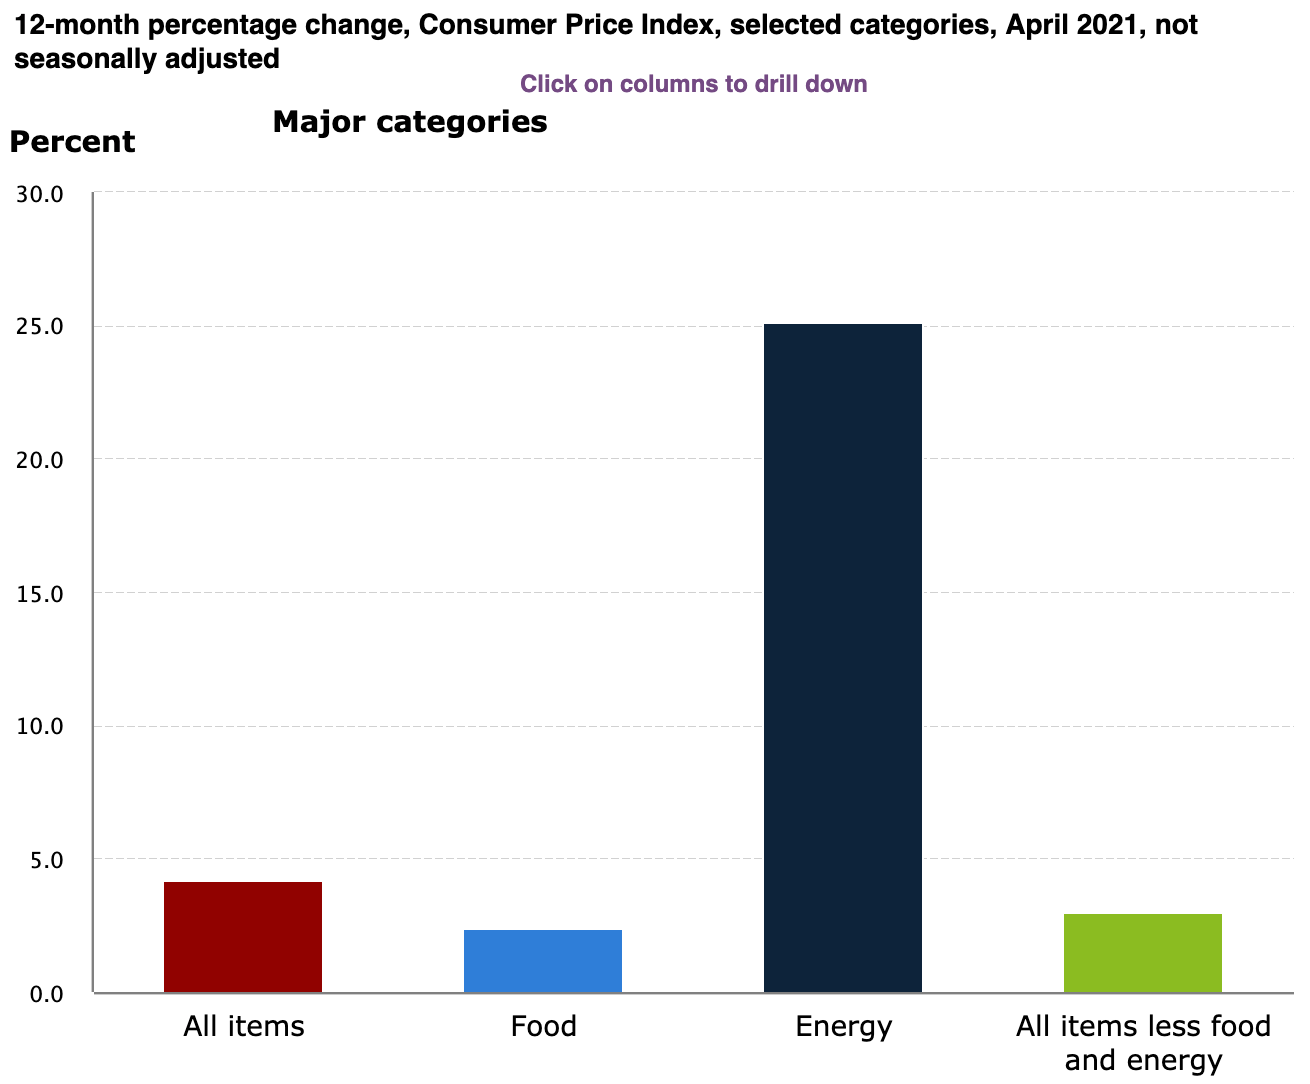
The Consumer Price Index for All Urban Consumers (CPI-U) increased 0.8 percent in April on a seasonally adjusted basis after rising 0.6 percent in March, the U.S. Bureau of Labor Statistics reported today. Over the last 12 months, the all items index increased 4.2 percent before seasonal adjustment. This is the largest 12-month increase since a 4.9-percent increase for the period ending September 2008.

Pent up and bottlenecked economy

The question is why this pace of increase or does this signal long-term problems. The most immediate causes relate to the re-opening of the economy. From MarketWatch:

The pace of inflation has surged after years of languishing at unusually low levels largely due to the rapid reopening of the U.S. economy.

Businesses can’t keep up in demand, a problem exacerbated by ongoing bottlenecks in the global trading system tied to the pandemic. Computer chips are especially in short supply and that’s held up production of new autos and other manufactured goods.

Americans are also rushing to dine out, travel or go far away for vacation, activities they shied away from during the pandemic. That’s also driving up prices at popular vacation resorts and other venues where people plan to congregate.

The first two reasons are pretty straightforward, but the third reason (pent up demand) is beyond question, even if this one is the most difficult to measure as it’s anecdotal and not enirely precise but we all observe it – everywhere is packed with people looking to get out and do something, anything. But the impacts are real and tangible as seen in the BLS data:

See full interactive (and drillable detail) here.

Apple and Gold as Market Barometer

Benzinga posted a very interesting comparison between gold prices and Apple Computer, as a measurement potential trend:

Gold investors have been waiting for this, The metal has been trending lower since August and after rebounding in April, it ran into resistance around $1,780. That put a halt on the rally…Now that resistance has been broken and a big move higher has been made….There’s a good chance it continues. With inflation here and a potential energy crisis on the horizon, a flight to safety has begun.

But the unexpected correlation: “One reason why the flight to safety has begun and gold is moving higher is the weakness in Apple Inc.” Apple has met resistance for months and the suggestion is that Apple, being so strong in earnings and organizational performance, yet underperforming as a security – could be a bearish signal overall.

Here is gold over the last year:

Now Apple:

Of interest as well, the gold backed digital asset PAXG over the last three months:

Californians population declined for the first year since 1900

From the DOF:

California’s population dipped by 182,083 residents last year, bringing the state’s total to 39,466,855 people as of January 1, 2021, according to new population estimates and housing data released today by the California Department of Finance (May, 2021).

The press release also reports that some of the decrease was attributed to excess deaths in 2020:

The COVID-19 pandemic increased California deaths in 2020 by 51,000 
average death rate for the three preceding years. “Excess deaths” rates above the past threeyear average – were observed in 51 of the state’s 58 counties. 

But the story is a mixed bag – there is significant growth in a number of inland cities, northern and southern but certainly not limited to those areas as illustrated in the interactive graphic from Cal Matters (see Cal Matters excellent write up here).

When Stocks Only Go Up?

Spoiler alert to the Wall Street Journal post, What Happens When Stocks Only Go Up – they don’t. But far more interesting than the impossibility of predicting a major correction, whether this time it’s really different, or some other alternative, is the exploration into the psychology of the investor (or trader):

In February 2020, before the pandemic had fully hit home, these investors estimated the odds of such a bear market at an average of only 4%. By April, just after the S&P 500 had fallen by one third, their expectations that the market would plunge again in the coming year nearly doubled to 8%.

Those fears swiftly faded. By last December, investors in the Vanguard survey estimated the probability of another crash in the ensuing 12 months at only 5%. That was slightly lower than their average estimate during the three years before the pandemic.

But one group was different:

…those who went into early 2020 with the highest expectations for stock returns in the upcoming year. They ended up reducing their exposure to stocks much more sharply during the crash of February and March 2020 than those who had been expecting lower returns.

Again, not necessarily by way of prediction but a historical account of the madness of the crowds that should at least give pause, “in the 1920s, a “new era” of technological disruption made caution look absurd—until stocks crashed by 89%.”

Optimism everywhere – as well as the expectation of inflationary pressures

A post in the Wall Street Journal last week reported pre-pandemic levels of consumer confidence and for good reason(s), “as more people received vaccinations, stimulus payments reached households and businesses more fully reopened.” Employment, stimulus, an opening economy, vaccinations – all very compelling and obvious drivers to an overall feel of things, as well as the continued disucssion of inflation and how this will shape policy choices in the mid to long-term.

The University of Michigan Surveys of Consumers shows a consistent trend (with the next update in two weeks):

The survey adds the following commentary on inflation the finds support for either direction with:

Each side in the current policy debate finds support in the consumer data. The recovery is far from complete as less than half of the fall in consumer sentiment has so far been recovered, and the current and prospective stimulus and infrastructure spending has the potential to spark a renewed inflationary psychology, although that will not occur immediately…

Inflationary psychology preceded actual inflation by about two years in the last bout in the 1970s. The key balance is not to underestimate the ultimate impact of those policies on jobs and inflation, and not to overestimate the ability of policies to bring any excesses to a painless soft-landing.

Similarly, in the May 1 Berkshire annual meeting Buffett noted on the one hand the last 20 plus years, “was not a highly inflationary period as a whole,” but what they are seeing is:

…very substantial inflation. It’s very interesting. We’re raising prices. People are raising prices to us, and it’s being accepted. Take home building. We’ve got nine home builders in addition to our manufactured housing operation, which is the largest in the country. So we really do a lot of housing. The costs are just up, up, up. Steel costs, just every day they’re they’re going up. And there hasn’t yet been because the wage stuff follows. The UAW writes a three-year contract, we got a three-year contract, but if you’re buying steel at General motors or someplace, you’re paying more every day. So it’s an economy really, it’s red hot. And we weren’t expecting it.

When asked in the Q & A his thoughts on the worry of “more inflation or that we will have a pretty dramatic fiscal monetary collision,” Buffett diplomatically answered, “we don’t know.”

Blistering earnings and consumer sentiment (Apple Computer)

It is always interesting to observe blockbuster earning results (genuine fundamentals) and realize what is good for business, the economy, and employment, often has little or nothing to do with what drives the capital markets. In other words, what’s good for business is not necessarily good for stocks, and vice versa. Put another way still, investor and consumer confidence are two entirely different things, sometimes. Take just one example with Apple Computer and the 5-day price movement:

How does that reflect a company that just reported earnings that are on track to exceed last year by 30%? Additionally, Apple reported

Profit of $23.6 billion in the latest quarter as revenue rose 54% to $89.6 billion, far exceeding Wall Street expectations. The company also announced a 7% increase to its cash dividend to 22 cents a share and that the board had authorized an increase of $90 billion to an existing share-repurchase program (Ameritrade).

A similar assessment with the same question in Barron’s:

At least a dozen analysts raised their targets for the (AAPL) stock price…and every single one of them raised their earnings estimates in response to the results…previous (Goldman) view that iPhone sales would disappoint during the pandemic was “clearly wrong.”

…growth of 66% in iPhone sales, 70% for Macs, 79% for iPads, and 25% for Wearables, with 27% growth in Services. The company posted 56% growth in Europe, and a remarkable 88% in China…

One obvious question is what can Apple do as an encore?

The suggestion that the earning report might be a little “too good” kind of sound like a search something to say in the absence of any real explanation. But the question of what happens in post-pandemic consumer behavior is a valid one:

“Will there be a trough on the other side as Covid-driven wallet share shifts return to normal?”…“We think the answer is unequivocally yes. It’s just hard to know when and how big that trough might be. We believe that iPad and Mac strength could persist for the next two quarters, but even if the WFH trend persists, we doubt the surge will rival this year’s” (Barron’s).

So again, this week the positive news seems to continue the concern over what happens on the other side of pent up recovery and stimulus, as well as the threat of rising interest rates. But on the good for business and consumer side of things, it is noted, “Apple remains our top idea as we think the hardware business is still in the early parts of a multi-year growth cycle aided by product refreshes and work from home/hybrid work environments.”

What a difference a year makes

While the Fed continues its stimulus through low rates and bond buying, optimistic news continues as reflected in the following (and practically everywhere) which raises questions about the path forward:

Kelly, D. (2021, April 19). Economic Update. J.P. Morgan Asset Management. https://am.jpmorgan.com/us/en/asset-management/adv/insights/market-insights/market-updates/economic-update/ 
Khan, K. (2021, April 23). Goldman Sachs says U.S. economic growth is peaking. SeekingAlpha. https://seekingalpha.com/news/3685126-goldman-sachs-says-us-economic-growth-is-peaking
Cox, J. (2021, April 23). The Fed is unlikely to hint at policy changes next week, even with a stronger economy. CNBC. https://www.cnbc.com/2021/04/23/the-fed-is-unlikely-to-hint-at-policy-change-despite-stronger-economy.html
Tepper, T., & Curry, B. (2021, April 16). 2021 April FOMC Meeting Preview: The Fed Remains On Guard. Forbes Advisor. https://www.forbes.com/advisor/investing/fomc-meeting-federal-reserve/

Of course those articles that were suggesting no action yesterday were right per the concensus. But the question remains for economists and investors: how much good news (and at what rate of recovery) is too much? As quoted in Reuters, “we do feel that a higher inflation reading this year and in 2022 will prove to be not transitory, that the Fed will hit that 2% threshold and above, if not even higher, on a more sustained basis. So that’s where I think we would be on the side of disagreeing with Chairman Powell, that we think inflation is going to gain a toehold.”

Fed Chair Transcript: No Changes for Now

As somewhat expected, the transcript from the Fed Chair today indicated no expected change to rates or bond buying activity in the immediate future. This prompts questions from economists regarding how long this can last given the good news that continues to emerge. For instance:

Economists think a decision to taper is months away although a minority think the Fed might start discussing the issue in June. Fed officials have said they want to see “substantial further progress” in meeting their goals of full employment and 2% inflation before tapering.

The post goes one to cite the recurring themes of optimism, inflation and pandemic risks as potential drivers for a change in policy.

Chair Powell reiterated that, “the FOMC and I kept interest rates near zero and maintained our sizable asset purchases. These measures, along with our strong guidance on interest rates and on our balance sheet, will ensure that monetary policy will continue to deliver powerful support to the economy until the recovery is complete.” Again, no surprise, but he continues, “while the recovery has progressed more quickly than generally expected, it remains uneven and far from complete.” 

But one brief comment also describes some of the most felt implications of Federal and local policy decisions (and recovery):

The economic downturn has not fallen equally on all Americans, and those least able to shoulder the burden have been the hardest hit. In particular, the high level of joblessness has been especially severe for lower-wage workers in the service sector.

In conclusion, the Fed will:

Continue to increase our holdings of Treasury securities by at least $80 billion per month and of agency mortgage-backed securities by at least $40 billion per month until substantial further progress has been made toward our maximum-employment and price-stability goals.

Which will in turn extend the trend of low interest rates, housing prices and asset inflation of all kinds.

The Future of Self-Driving Cars – Designed Around People (132 years later)

Although the deployment of a number of technologies may have been delayed due to the pandemic, others may accelerate as a result of it. Just as the pandemic and lockdown removed the barrier (now 20 years into the 21st Century!) for paperless workflow in the office, remote meetings, remote work, education disruption, etc., others may be demanded and accepted for a number of reasons and preferences in a post-pandemic world as noted in the Wall Street Journal:

“Over the last 100 years you can’t really say the car was designed around the people; they got what space was left over”…

…As the auto industry contemplates the impact of technology—from electric cars, internet connectivity, and ultimately vehicles that drive themselves—designers are reinventing the interior of the automobile and how its passengers experience the ride. One doesn’t have to imagine some fantastic future with Jetsons-like inventions zipping around on the ground and in the air because the future is already on the drawing boards of car makers today.

What is most striking in these automobile innovations (and very consistent with the unfolding of the whole pandemic response) is the great reversal that cars now represent as a “safe space.” This of course is it due to both the inherent risk of traveling as well as the potential inconvenience of protracted wait times (or potentially getting stranded). So traveling within a large state such as California, people may simply choose to use their cars. The “oasis” concept revolves around the eventual full engagement of self-driving vehicles, technology with “head up” screens and embeded within the window, space utilization for sleeping, and ride-hailing/self-parking, all designed to prividing to create a viable and formitable competitor to air travel.

Again, what is most interesting is that these concepts are not new, but the demand may entirely shift due to the realities of a post-pandemic world. See the full WSJ post here.

Purchasing Power Parity GDP Per Capita – Geo-FRED Interactive Map

As with a number of measures that have recently called our traditional models into question and the way we understand economic activity, the FRED Blog suggests there may be limitations to some of the mechanisms we have used for more than seventy years:

GDP has been used as a measure of economic well-being since the 1940s: It measures the total economic output by individuals, businesses, and the government and is a tangible way to quantify the state of the economy. However, some economists have questioned how well GDP measures well-being: For example, GDP fails to account for the quality of goods and services, the depletion of natural resources, and unpaid jobs that are nevertheless important (e.g., household chores). Although this criticism may be well founded, GDP is highly correlated with other measures of well-being, such as life expectancy at birth and the infant mortality rate, both of which capture some aspects of quality of life.

It’s a self-obviating point that developed nations would have much “higher levels of per capita GDP have, on average, higher levels of income and consumption,” or purchasing power. But other factors weigh into the question of how well off we are in terms of quality of life. Measures such as life expectancy and general health add to the discussion of well-being.

See the interactive map below for a “correlation between GDP and other measures of well-being” where GDP is “still a reasonable proxy of the overall well-being” for any given economy:

See the full FRED post here.

FRED Blog: Healthcare Inflation vs. General CPI

In an interesting post from the FRED Blog, Healthy inflation? Inflation in the healthcare industry vs. general CPI, a comparison is set up between elements of the consumer price index, versus the rate of rising costs related to healthcare. The authors point out (what most of us have known for decades) that medical care has risen faster than the other components in the CPI basket:

Going back as far as the series are available, since 1948, the price of medical care has grown at an average annual rate of 5.3% while the entire basket, headline CPI, has grown at an average annual rate of 3.5%. In the past 20 years, in the regime of stable inflation, headline CPI has grown at an average annual rate of 2.2%, whereas the price level of medical care has grown at an average annual rate of 3.6%—about 70% faster.

The post continues addressing why this matters, beyond the obvious and anecdotal, namely, policy implications, impact to the average consumer, retirees and those with stagnant wages:

The implication of these two features is far reaching: It’s symptomatic of the increasing share of income the U.S. spends on medical care. Beyond macro trends, the features of these two series themselves have policy implications. Indeed, indexing government healthcare budgets to overall CPI rather than medical care prices has implications for spending in real terms. This gap could also widen during recessions, when government help may be most in demand.

This does not bode well given current policy discussions, as noted in the Wall Street Journal, “any replacement health plan that satisfied GOP conservatives was likely to be opposed by the party’s centrists, and vice versa.” See the full FRED post here.

Philadelphia Fed Forecast: Slightly Stronger vs. Three Months Ago

According to the Philadelphia Fed’s Real-Time Data Research Center, the outlook for 2017 is slightly upbeat, particularly compared to a few months back:

The U.S. economy over the next four quarters looks slightly stronger now than it did three months ago…forecasters predict real GDP will grow at an annual rate of 3.1 percent this quarter, up from the previous estimate of 2.3 percent. Quarterly growth over the following three quarters also looks improved. On an annual-average over annual-average basis, the forecasters predict real GDP will grow 2.1 percent in 2017, 2.5 percent in 2018, 2.1 percent in 2019, and 2.3 percent in 2020.

An improved outlook for the unemployment rate accompanies the outlook for growth. The forecasters predict that the unemployment rate will average 4.5 percent in the current quarter, before falling to 4.4 percent in the next two quarters, and 4.3 percent in the first two quarters of 2018. The projections for the next four quarters (and the next four years) are below those of the last survey, indicating a brighter outlook for unemployment.

The forecasters assign the following mean probability to GDP growth rates this year:

Mean Probability

Note on Inflation

One persistent element is the inflation outlook in the coming years.  The forecasters note a downward revision:

The forecasters expect current-quarter headline CPI inflation to average 1.6 percent, lower than the last survey’s estimate of 2.3 percent. Similarly, the forecasters predict current-quarter headline PCE inflation of 1.2 percent, also lower than the 2.0 percent predicted three months ago.

Measured on a fourth-quarter over fourth-quarter basis, headline CPI inflation is expected to average about 2.3 percent in each of the next three years, little changed from the last survey. The forecasters have revised downward their projections for headline PCE inflation in 2017 to 1.8 percent, but they pegged the rates for 2018 and 2019 at 2.0 percent, unchanged from the last survey.

Over the next 10 years, 2017 to 2026, the forecasters expect headline CPI inflation to average 2.30 percent at an annual rate, unchanged from the last survey. The corresponding estimate for 10-year annual-average headline PCE inflation is 2.09 percent, little changed from the 2.10 percent predicted in the previous survey.

While not completely unexpected, this inflation forecast demonstrates an interesting shift, especially given the state of full employment. See the full writeup with lots of stats here.