Volume at the Ports: Record Year at the Port of Los Angeles

It was a record year at the Port of Los Angeles:

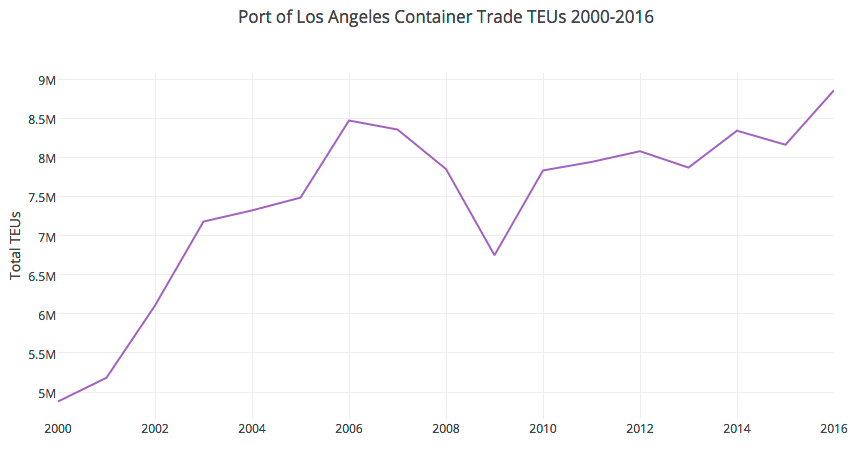
Cargo volumes at the Port of Los Angeles reached 8,856,782 Twenty-Foot Equivalent Units in 2016, marking the busiest year ever for a Western Hemisphere Port. The previous record was set in 2006, when the Port of Los Angeles handled 8,469,853 TEUs.

Attributed to the success is cited as understanding:

…”the importance of innovating and collaborating to move our economy forward,” said Mayor Eric Garcetti. “We have seen incredible progress over the last two years, and it speaks to the hard work and partnership between the City, business leaders, and the workers who keep our port running smoothly every day.”

The Port finished the year strong, with December volumes of 796,536 TEUs, a 27 percent increase compared to the same period last year. It was the Port’s busiest December and fourth quarter in its 110-year history. Overall in 2016, cargo increased 8.5 percent compared to 2015.

The end of the calendar year 2016 showed the following shipment activity:

Port of Los Angeles Container Trade TEUs 2000-2016

To put this milestone into perspective, look at the same time span filtered to total containers only (this illustrates the long crawl forward since the mid-2000s): Total Containers POLA
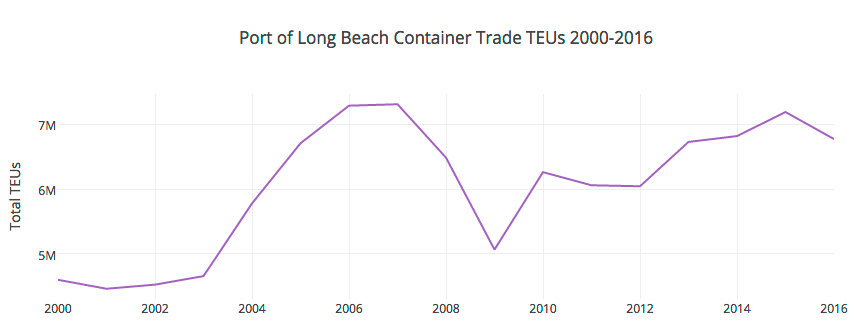
The Port of Long Beach had a little different year, but still posted strong results in spite of challenges:

Slowed by industry headwinds and challenges that included a major customer declaring bankruptcy, the Port of Long Beach still moved almost 6.8 million containers in 2016, its fifth best year ever.

Overall cargo declined 5.8 percent in 2016 compared to 2015, as the Port was impacted by new ocean carrier alliances and the August bankruptcy of Hanjin Shipping, a South Korean company and former majority stakeholder at the 381-acre Pier T container terminal — Long Beach’s largest.

By year’s end, the Harbor Commission had approved an agreement for a subsidiary of Mediterranean Shipping Co., one of the world’s largest container ship operators, to take sole control of the long-term lease at Pier T.

…“Last year was turbulent, with numerous ocean carrier mergers and other changes,” said Harbor Commission President Lori Ann Guzmán. “Now we have one of the largest ocean carriers in the world as a major partner and we’re well positioned to rebound in 2017. While the industry strives for equilibrium, Long Beach will continue be a reliable port of entry and continue to provide the fastest, most efficient services for trade from the Far East.”


Plot 378

Again, the change in volume since the mid-2000s is even more felt when viewing total containers only:

Total Containers POLB

20th Anniversary of One of the Most Iconic Expressions in Finance: Irrational Exuberance

Irrational exuberance has been one of the most iconic and recognizable phrases in the financial markets for the last twenty years – to the day. I remember this like it was yesterday, being a recent graduate and shortly after, working in the capital market. This really was the advent of an era where there has been no looking back: a tenuous and ambivalent relationship with the Fed and every nuance uttered by the Chair. Here is the full quote in its context:

Clearly, sustained low inflation implies less uncertainty about the future, and lower risk premiums imply higher prices of stocks and other earning assets. We can see that in the inverse relationship exhibited by price/earnings ratios and the rate of inflation in the past. But how do we know when irrational exuberance has unduly escalated asset values, which then become subject to unexpected and prolonged contractions as they have in Japan over the past decade? And how do we factor that assessment into monetary policy? We as central bankers need not be concerned if a collapsing financial asset bubble does not threaten to impair the real economy, its production, jobs, and price stability. Indeed, the sharp stock market break of 1987 had few negative consequences for the economy. But we should not underestimate or become complacent about the complexity of the interactions of asset markets and the economy. Thus, evaluating shifts in balance sheets generally, and in asset prices particularly, must be an integral part of the development of monetary policy.

Read the full speech from the minutes here.

Interestingly enough, here is some commentary in our present time declaring, “rationally exuberant,” (caveat emptor on long positions if you ask me):

Not everyone is convinced of this view to be sure:

In recent years the Fed has only doubled down on these policies by directly pursuing a “wealth effect.” Rather than give a boost to the broad economy, however, these central bankers have only accomplished an even greater and more pervasive financial asset perversion. Stocks, bonds and real estate have all become as overvalued as we have ever seen any one of them individually in this country. The end result of all of this money printing and interest rate manipulation is the worst economic expansion since the Great Depression and the greatest wealth inequality since that period, as well.

See the full post here.

Apps for Economics

I found this excellent site in the Journal of Economic Education as I was researching another topic. In that article, the following overview describes the useful content cataloged on the site:

As the digitization of teaching resources becomes increasingly available, instructors can adapt by making course pedagogy more mobile through incorporating “bring your own device” into the course design. The number of available apps can be overwhelming. We identify many of the best apps with user rankings on a 5-point qualitative scale from Awful (1) to Excellent (5).

Why should we use apps in economics? Strategic selection of an app engages students. This selection offers understanding throughout a range of cognitive domains while providing connections to learning styles that link to individual strengths. Apps provide a hands-on study of economics that can intrigue and satisfy. When students have fun engaging economic apps, their learning and retention increases. Our Web site arranges the apps into seven categories: Study Aids, Calculators, Data, Events, Feedback, Quizzes, and Simulations. Study Aids provide resources for better understanding principles of economics. Calculators identify spreadsheets as well as financial, mortgage, and currency calculators. Data apps profile domestic and international macroeconomic data sources. Events allow class members to keep abreast of current events. Feedback offers instructors a variety of mechanisms to gather classroom responses. Quizzes afford students tools for selftesting of economic concepts. Simulations generate a virtual world to put economics into practice. (Cochran, Velikova, Childs & Simmons, 2015).

 The site is authored by an excellent team of innovators, researchers and educators who have a “passion for technology.” This site is an excellent resource and I hope it continues to be updated.


Reference:

Cochran, H. H., Velikova, M. V., Childs, B. D., & Simmons, L. L. (2015). Apps for Economics. Journal Of Economic Education, 46(2), 231. doi:10.1080/00220485.2015.1006745

WSJ: Is Growth in the Gig Economy Stalling Out? – Flattening Growth Trend in Uber, Etsy and Airbnb

The Wall Street Journal asks, Is Growth in the Gig Economy Stalling Out? Flattening trends are seen using information from Morgan Chase & Co. related to earnings from “Uber, TaskRabbit, eBay, Airbnb and nearly 40 other sites considered part of the “gig economy.””

These new sites and platforms hold the potential to radically reshape the American workforce, leaving a growing number of employees severed from traditional payroll jobs. But just how much is that actually happening? Research has suggested that most of the rise in independent contracting has been happening outside of these high-profile online platforms. And now, the latest data from JPMorgan suggests growth in the number of active users of online platforms is slowing down.

cxunuuqwiamod3r

The report distinguishes between two types of platforms: those where users sell “capital,” whether it’s goods on eBay or Etsy or renting apartments, and those where users sell “labor,” such as Uber, Lyft, TaskRabbit and so on. They find that about 1% of adults are active on such platforms in any given month. That’s up, but only a little bit, from estimates made earlier this year. The period of explosive growth for this type of work may be over. (Only a trivial number of people use both types of platforms.)

This extraordinarily high turnover “implies that growth in online platform participation is highly dependent on attracting new participants or increasing the attachment of existing participants,” the report says. In other words, if companies in the gig economy want to keep growing, they need a strategy to stop people from quitting after a few months.

The post cites a remarkable number of adults who have participated in shared economy jobs but an extraordinarily high rate of churn from these jobs inside of a year. This actually resembles similar trends that occur during normal economic slowdowns where professionals or skilled labor temporarily take on unrelated, sometimes reasonable earning temporary work. But it appears there is a shift back to traditional jobs rather than a new trend that was going to change the world.

Motor Intelligence July Auto Sales

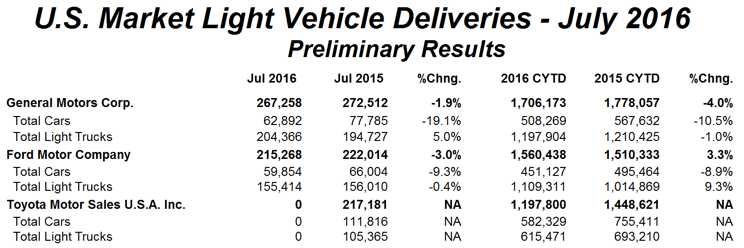
Results from Motor Intelligence returned the following for the nation’s top three automakers:

Autodata 2016 08 02

From the Wall Street Journal:

Sales for the top three auto makers selling in the U.S. slipped in July, reinforcing the view that the light-vehicle market has plateaued after six consecutive annual volume increases.

Declines at General Motors Co., Ford Motor and Toyota Motor Corp. overshadow increases by smaller players; including Nissan Motor Co. and Honda Motor Co. The sustained run of sales gains in the U.S. since the financial crisis has allowed most auto makers to limit reliance on discounts and keep inventories lean, padding profits generated by increased demand for trucks and sport-utility vehicles.

…The auto industry’s recovery has been a bright spot for the U.S. economy, with high factory utilization spurring new jobs, investment in American facilities and wage growth for Detroit’s auto workers. Car buyers spent $49 billion on light vehicles in July, according to TrueCar Inc., up 1% amid longer loan terms and a boom in subsidized auto leases—trends that keep monthly payments on par with a decade ago even as sticker prices go up.

…Overall retail sales are a trouble spot as purchases made by individual customers in showrooms have stalled this year, down slightly for the first seven months, according to JD Power. Auto makers are betting sales to government agencies, rental-car firm and commercial fleets will continue to grow.

…July’s results follow the sober view Ford executives gave last week when reporting second quarter earnings.

BT-AK221_CARSAL_9U_20160802134810

This is certainly a flattening trend from last year’s high, but I would tend to agree with the article’s assessment (quote), “this isn’t doomsday.” In other words, slowing, flattening and even headwinds is not the same thing as a crash, but in our projections for the coming year, we should at least take note and plan accordingly.


Residential Homeownership at More than a 50-Year Low

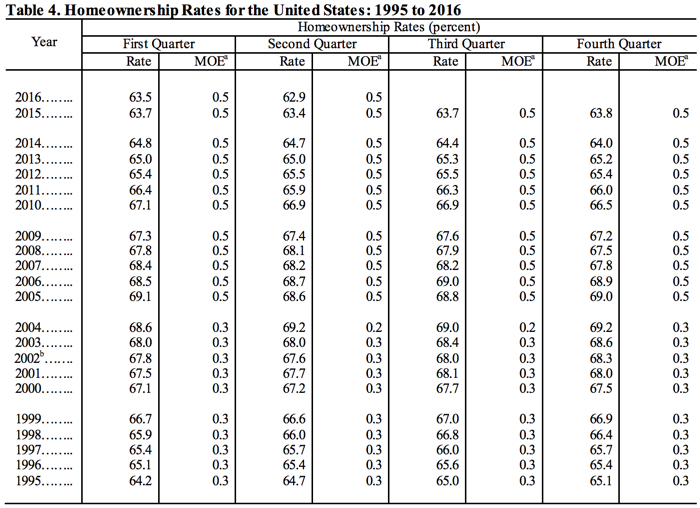
The Census Bureau updated its quarterly Housing Vacancies and Homeownership (CPS/HVS) and returned the following results:

Table 4 2016-07-28

As illustrated by the information in the table, homeownership in the U.S. continues to produce negative results as noted by the Wall Street Journal:

The U.S. homeownership rate fell to the lowest level in more than 50 years in the second quarter of 2016, a reflection of the lingering effects of the housing bust, financial hurdles to buying and shifting demographics across the country.

But the bigger picture also suggests more Americans are gaining the confidence to strike out on their own, albeit as renters rather than buyers.

The homeownership rate, the proportion of households that are owner-occupied, fell to 62.9%, half a percentage point lower than the second quarter of 2015 and 0.6 percentage point lower than the first quarter 2016, the Census Bureau said on Thursday. That was the lowest figure since 1965.

These last statistics are reflected in the interactive FRED chart below:


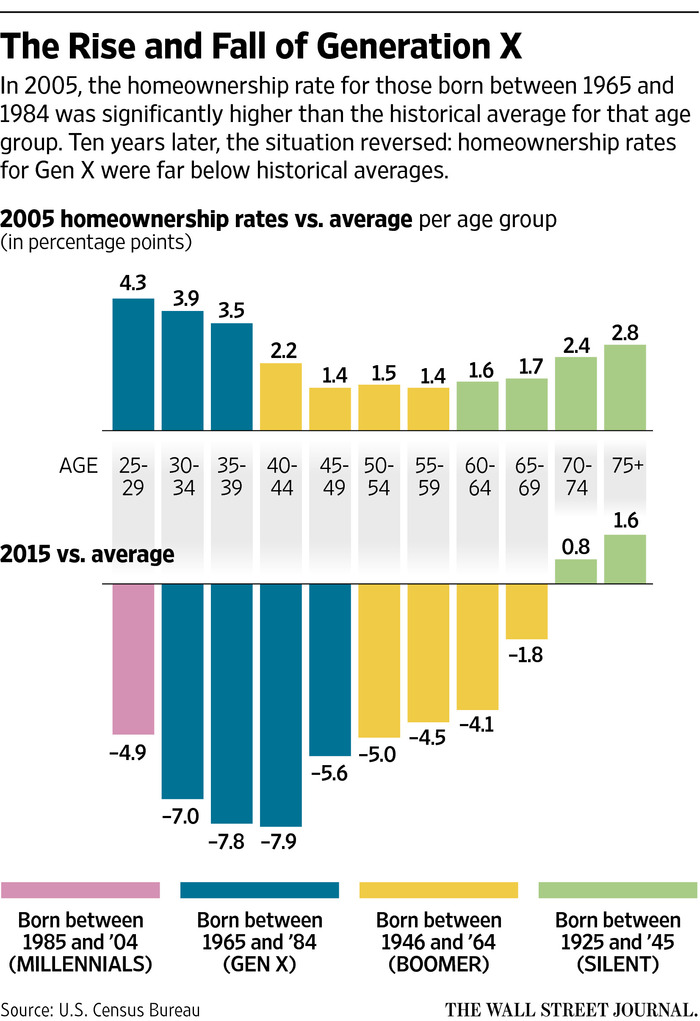
One very interesting element of the homeownership trend is the sociological shakeout among generational groups, with some results as expected, and others left for more in-depth studies:

NA-CJ738_GENX_9U_20160408150908

Source: The Wall Street Journal: http://www.wsj.com/articles/housing-bust-lingers-for-generation-x-1460142759

The full Bureau of Census report can be viewed here and the quarterly updates here.

Three Measures of Unemployment

The FRED Blog has an interesting assessment of unemployment, as measured by the 4-Week Moving Average of Initial Claims, Civilian Unemployment Rate and Average (Mean) Duration of Unemployment:

Take note especially of the Average (Mean) Duration of Unemployment – this corresponds to the “Scariest jobs chart ever” at Calculated Risk. From the FRED Blog using the analogy of the “unemployment bathtub”:

Economists often find a bathtub to be a useful metaphor for the behavior of unemployment. There’s some inflow of newly unemployed workers and some outflow as workers find jobs. A classic way to measure the inflow has been with initial claims of unemployment benefits, the blue line, in which we see spikes at the start of each recession. This inflow of newly unemployed persons initially reduces the mean duration of unemployment, the green line. But the green duration line rises as the blue initial claims line falls—since people who become unemployed early in the recession and remain so are unemployed for a while by the time the recession winds down. Every recession follows this pattern: Claims peak, then unemployment peaks, then duration peaks. The logic is essentially that of the bathtub: First it fills quickly; then, after some time, it begins to drain. But as this is happening, those left in tub have been there longer and longer.

The alarming measurement was just how long it took to reach pre-recession peak levels of jobs lost – a level reached “April 2014 with revisions.” Since we have met and exceeded this level for some time, the concerns now turn to issues such as the levels of employment (part-time temporary vs. full-time) as well as the “quality of jobs.”

FRB Atlanta GDPNow: Q2 Throttled Down Slightly

From the FRB Atlanta nowcast:

The GDPNow model forecast for real GDP growth (seasonally adjusted annual rate) in the second quarter of 2016 is 2.5 percent on May 17, down from 2.8 percent on May 13. The second-quarter forecast for real residential investment growth declined from 5.3 to 2.5 percent after this morning’s housing starts release from the U.S. Census Bureau, the forecast for real consumer spending growth ticked down from 3.7 percent to 3.6 percent after this morning’s Consumer Price Index release from the U.S. Bureau of Labor Statistics, and the forecast for the contribution of inventory investment to second-quarter growth declined from -0.24 percentage points to -0.39 percentage points after this morning’s industrial production release from the Federal Reserve. The latter decline was concentrated in motor vehicle and parts dealers’ inventories.

NOWCast 2016-05-17Get the full dataset here and report here.

The Implications of Policy on Public Behavior

The FRED Blog posted a very interesting dataset that illustrates the sway that public policy holds on public behavior, spending decisions and in this case, wealth preservation, “taxpayers adjusted their various income streams by trying to shift income from the beginning of 2013 to the end of 2012. This shift applies primarily to capital income.” The results are illustrated below in a customizable FRED graph:

Other comments in the post help explain the variance between two identical datasets (with the same label):

Both lines have the same title, real disposable personal income per capita, and yet they look very different. The extra careful reader will notice one series has a yearly frequency and the other has a monthly frequency. Here, frequency matters a lot, but not because of the usual concerns about seasonality. Income climbs steeply at the end of 2012 before falling dramatically in January 2013. This has to do with the so-called fiscal cliff: A series of temporary income tax cuts were set to expire on December 31, 2012, increasing the tax rate on personal income for many people in potentially significant ways.

This is quite interesting as it relates to this particular variance, but take a look at the same data from the last sixteen years:


What explains the variances showing very similar patterns? (Including a spike/cliff right in the middle of the Great Crash of 2008.) See the full post here.

Sluggish Wage Growth, Trend or Cycle?

The suggestion that wages have not kept time with costs, even as unemployment has continued to decline is unlikely to surprise anyone, such as the following commentary in the Economist:

Low unemployment means that employers have to try harder to find new workers, while existing workers can threaten to move elsewhere. As a result, workers should be able to demand higher wages. Yet firms in America seem not to have got the message. Inflation-adjusted wages for typical workers are stagnant. In fact, they have barely grown in the past five years; average hourly earnings rose 2% year-on-year in February of 2015: about the same as in February of 2010.

FRED demonstrates this same wage data as a trend, that since the 1980’s has diverged from GDP. The graph below shows the same data as comparative indexes where “it’s immediately apparent that the GDP figure is now higher than wages, meaning that it has grown faster since the 1980s:”

The post notes this caveat when trying to aggregate wages:

It’s not totally obvious how we should define wages—because wage dynamics change so much over the distribution. Low, medium, and high wages have grown at different rates and at different times. From a macroeconomic perspective, however, it makes some sense to measure the average wage. The effect of so doing is that we put more weight on the higher earners than the average person, a result of a positively skewed wage distribution. (Recall the definition of skewness: Here, it means the top tail can pull up the mean past the average person’s wage, the median wage.)

But why? According to the same post, both GDP and BLS data “plummeted in the Great Recession, but since then have been growing at about the same pace. The decline in wages as a fraction of GDP is not a result of a sluggish recovery from the Great Recession, but rather from effects predating it.” This still does not explain why, but more or less, what has happened. Again, the same post in the Economist suggests a “wage hangover,” where “firms preferred to return to more normal management conditions, and to let too-high wages adjust over time: “pent-up” wage cuts have been achieved simply by not granting raises. Wages, in other words, are not rising by more because in many cases they are already too high.” Wow! That is so simple yet reasonable, it may very well be a significant factor contributing to this trend. Another factor cited is what many of us know anecdotally as well as from the data: “part-time for economic reasons” and other forms of un- or under employment.

Fed Chairwoman: Trying to Build Consensus Among Disparate Views on Policy

Even with all the discussion of the implications of China’s Move to Devalue the Yuan, it has been widely accepted that a policy of firming easy money would probably still move forward. But this could prove more challenging for the Fed given the variegated opinions among policy makers:

Officials have signaled for months they intend to start raising short-term rates from near-zero interest before year-end. But they have provided no clear sign of having settled on whether to move at their next policy meeting Sept. 16-17. Minutes of their July 28-29 meeting, released Wednesday, underscored why the decision remains a close call.

“Most [officials] judged that the conditions for policy firming had not yet been achieved, but they noted that conditions were approaching that point,” the minutes said.

That passage might be read as a hint that officials saw a September rate increase in the cards, but the minutes showed officials had wide-ranging views about taking that step and several notable sources of trepidation.

The Fed has said it won’t move rates until it is more confident inflation will rise toward its 2% target after running below it for more than three years. “Some participants expressed the view that the incoming information had not yet provided grounds for reasonable confidence that inflation would move back to 2 percent over the medium term,” the minutes said.

The conundrum is self obviating: move too fast, and you are going to tank this forward moving, but tepid recovery. Do nothing, and you might have fueled yet another bubble. And there are voices calling for action citing the need for credibility, confidence and timing, others, for caution:

Other developments are giving Fed officials new reason for caution. At the July meeting they noted China’s stock-market declines; since then Chinese officials have allowed their currency to depreciate, a new source of concern about the growth outlook in the world’s second largest economy.

U.S. crude oil prices hit a six-year low Wednesday and U.S. stocks tumbled, boosting demand for ultrasafe U.S. government debt. The yield on the benchmark 10-year Treasury note fell to 2.129% from 2.196% on Tuesday and marks the yield’s lowest closing level since May 29. A gauge of 10-year inflation expectations in the bond market fell to the lowest level since January.

So back to the conundrum. Wait and by implication, call into question the health of the U.S. economy, or move forward and see if the economy “would be able to absorb higher interest rates and that inflation was moving toward the committee’s objective.” That’s life in the big chair.

WSJ: A yuan for your thoughts, Janet?

Last week saw a whole array of opinions, outrage (misguided, genuine or contrived) and interminable commentary on the implications of China’s actions earlier last week while still maintaining the status of [just shy of] currency manipulators by the U.S. executive branch. Earlier this week in the Journal, China Moves to Devalue Yuan:

China’s yuan has been on an upward track for a decade, during which the country’s economy grew to be the second largest in the world and the currency gained importance globally. The devaluation Tuesday was the most significant downward adjustment to the yuan since 1994, when as part of a break from Communist state planning, Beijing let the currency fall by one-third.

China sets a midpoint for the value of the yuan against the U.S. dollar. In daily trading, the yuan is allowed to move 2% above or below that midpoint, which is called the daily fixing. But the central bank sometimes ignores the daily moves, at times setting the fixing so that the yuan is stronger against the dollar a day after the market has indicated it should be weaker.

With Tuesday’s move, the fixing will now be based on how the yuan closes in the previous trading session. As a result, the yuan’s fixing was weakened by 1.9% Tuesday from the previous day, leaving it at 6.2298 to the U.S. dollar, compared with 6.1162 on Monday. The yuan dropped as much as 1.99% from its previous close to 6.3360 against the dollar in Shanghai and fell as much as 2.3% in Hong Kong in early trading.

Ironically, this move was ostensibly to allow the market to play a greater role in the value of China’s currency. But contra to this view:

“The real proof in whether this change is about reform or growth will come when authorities resist the urge to intervene down the road when another policy goal that could be achieved by a significant revaluation or devaluation comes knocking,” said Scott Kennedy, an analyst at the Center for Strategic & International Studies, a Washington think tank.

“China wasn’t able to resist that urge on the stock market, so the government doesn’t get the benefit of the doubt on this quite yet,” Mr. Kennedy said, a reference to China’s recent moves to prevent further declines in its equities markets.

What about Inflation?

In an opinion post, Rate Watchers Read the Chinese Tea Leaves, the authors makes an interesting point regard another variable that could complicate matters:

Speaking before and after the step, respectively, Atlanta and New York Federal Reserve Bank presidents Dennis Lockhart and William Dudley cast doubt on the notion that run-of-the mill macroeconomic turbulence would delay a September increase. And a survey of 60 economists by The Wall Street Journal conducted mostly before China’s bombshell showed that 82% expected an increase next month.

But what about its effect, at the margin, on a critical set of U.S. economic data? Namely, inflation. Friday’s producer-price index and Wednesday’s consumer-price index will be the penultimate readings before the big decision.

…With markets recovering somewhat from the shock, China’s move probably won’t delay a September hike. But its contribution to slower price gains overall could slow the pace of Fed tightening.

 See more analysis here: