Fed Capital Requirements: Bearing the Cost that Failure Would Impose on Others

Too big to fail is a narrowing option. And running with riskier assets is going to be costly for larger banking institutions, according to new rules by Federal Reserve as noted in the Wall Street Journal:

The Fed completed one rule stating that the eight largest banks in the country should maintain an additional layer of capital to protect against losses, its plainest effort yet to encourage them to shrink. At the same time, it offered a reprieve to General Electric Co.’s finance unit from more-intensive regulation, after the company promised to cut its assets by more than half.

…Regulators have pushed big banks to expand their capital buffers to better absorb losses, reduce their reliance on volatile forms of funding, improve their risk management and cut back on risky assets. So-called stress tests measure banks’ resilience each year and can restrict shareholder payouts at firms that don’t pass.

For Wall Street banks and their investors, the emerging regime presents a series of choices: specifically whether to pay the cost of new regulation, which will fall to the bottom line, or change their business models by shedding businesses or withdrawing from certain markets, such as owning commodities.

In a quote that I think is one of the best commentaries on the subject,

Fed Chairwoman Janet Yellen, before voting to approve the new measure, said financial firms must “bear the costs that their failure would impose on others.” She offered banks the choice of maintaining more capital to reduce the chance they would fail, or get smaller and reduce the harm their failure would have on the financial system.

The big banks of course object to the action stating that it will remove billions from the economy. Below is a graph of the big 8 that will be hit with he most significant requirements (click for larger image):

Bigger Buffer

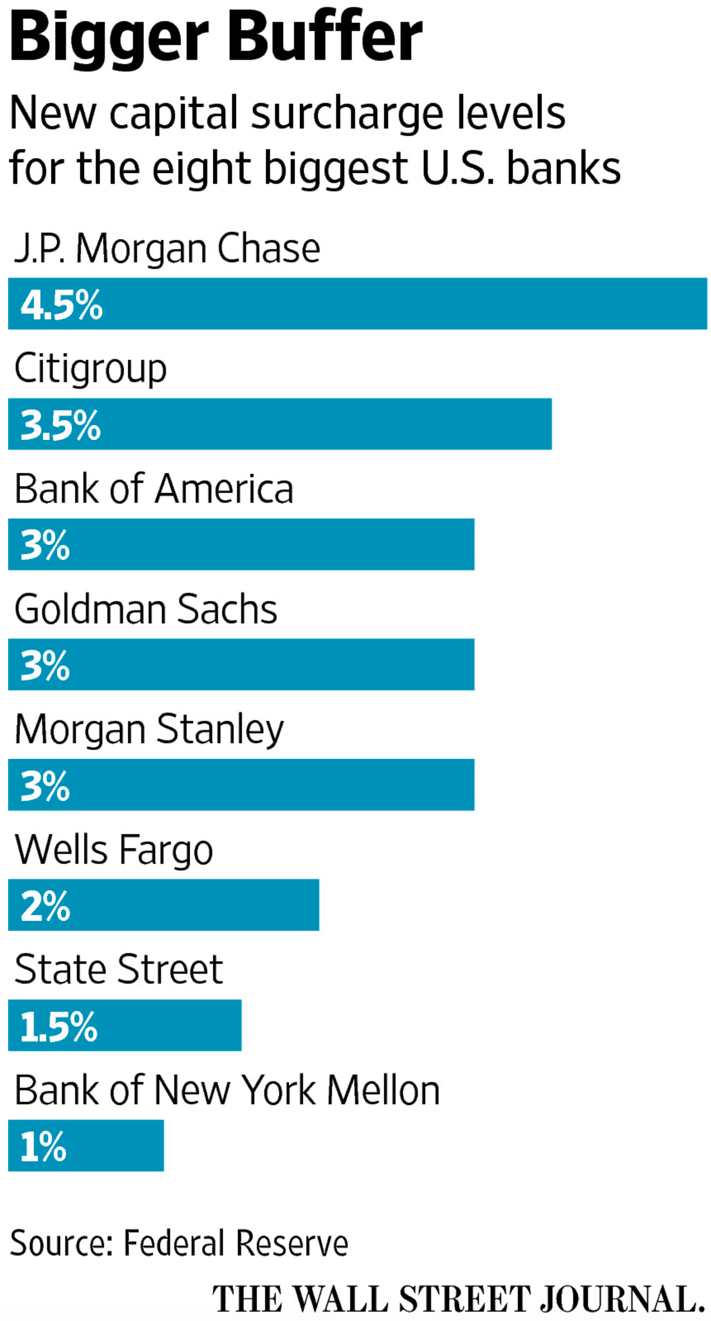
But it is not size along that determines how each bank will be assessed, “the size of each bank’s additional capital requirement is tailored to the firm’s relative riskiness, as measured by the Fed’s formula, which considers factors such as size, entanglements with other firms and internal complexity. As those factors shrink or grow, so will a bank’s surcharge.”

Volume at the Ports and Twenty Years of Trends

While the ports of Long Beach and Los Angeles have trends that are somewhat at parity with one another, they certainly do not necessarily move in tandem. Which is probably the self-obviating point of different cargo. That said, I thought it would be interesting to plot the last twenty years of activity for the two ports. The Port of Los Angeles gets a little more granular with their posted statistics, but for the purpose of comparison, both data sets for the two interactive charts were set up consistently.

May showed the following shipment activity at the Port of Los Angeles:

Containerized cargo volumes edged up .8 percent compared to the same period last year. The Port handled a total of 694,791 Twenty-Foot Equivalent Units (TEUs) in May 2015…Imports decreased .8 percent, from 351,403 Twenty-Foot Equivalent Units (TEUs) in May 2014 to 348,427 TEUs in May 2015. Exports declined 3.5 percent, from 158,473 TEUs in May 2014 to 152,917 TEUs in May 2015…Factoring in empties, which increased 7.9 percent, overall May 2015 volumes (694,791 TEUs) increased .8 percent. For the first five months of 2015, overall volumes (3,181,718 TEUs) are down 4 percent compared to the same period in 2014.

Mouse over the charts to see the underlying data, or select/de-select items from the legend:

Port of Los Angeles Container Trade TEUs

On the other hand, the port of Long Beach had the following swing in activity:

Cargo rose at the Port of Long Beach by 6 percent in May, the third consecutive month of growth, the busiest month since October 2007, and the busiest May since 2006. A total of 635,250 TEUs (twenty-foot equivalent units) of containerized cargo were moved through the Port in May. Imports numbered 327,317 TEUs, a 4.8 percent increase from the same month last year. Exports decreased 7.4 percent to 135,855 TEUs. Empty containers rose 22.6 percent to 172,078 TEUs. With imports exceeding exports, empty containers are sent overseas to be refilled with goods.

Port of Long Beach Container Trade TEUs

This is a welcome surge of activity as the fiscal year to date measurement of cargo is still lightly contracted from 2014. The Port of Long Beach attributes some of the volume to be due to a “stronger retail market,” as well as added activities and services “in order to boost cargo growth.”

The Marginally Attached – A Look at the Five Largest States

The U.S. Bureau of Labor Statistics (BLS) defines marginally attached in simple, straightforward language:

Marginally attached workers
Persons not in the labor force who want and are available for work, and who have looked for a job sometime in the prior 12 months (or since the end of their last job if they held one within the past 12 months), but were not counted as unemployed because they had not searched for work in the 4 weeks preceding the survey. Discouraged workers are a subset of the marginally attached.

Discouraged workers
Persons not in the labor force who want and are available for a job and who have looked for work sometime in the past 12 months (or since the end of their last job if they held one within the past 12 months), but who are not currently looking because they believe there are no jobs available or there are none for which they would qualify.

For the purpose of illustration, the FRED graph below has the top five states  selected (which accounts for more than a third of the nation’s population), showing the trend of marginally attached workers for more than a decade.

The trend lines show the inherent headwinds since the beginning of economic recovery in June 2009. The still “on the grid” numbers of the marginally attached and discouraged workers has hung on much longer than a decade ago. What’s more, six years into recovery, not one of these states has returned to its pre-recession level of the marginally attached:

Marginally Attached-Pre-Recession

This could be due in part to an aging population as well as population shifts and growth in general. This also illustrates why for so many, the recovery has not felt like a recovery. The reality is, jobs are being added as illustrated by the decreased levels of the marginally attached from the corresponding peak levels by state (peak levels were between July 2010 and October 2011):

Marginally Attached Percentage Below Peak Levels

Burst of Volume at the Port of Los Angeles

Significant volume surge at the Port of Los Angeles with a rise in containers of nearly 14% per today’s news release,

The Port of Los Angeles has released its June 2014 containerized cargo volumes. In June 2014, overall volumes increased 13.89 percent compared to June 2013. Total cargo for June was 736,438 Twenty-Foot Equivalent Units (TEUs), the largest volume in monthly containers since September 2012.

Container imports rose 16.55 percent, from 328,324 TEUs in June 2013 to 382,666 TEUs in June 2014. Exports rose 8.51 percent, from 148,203 TEUs in June 2013 to 160,823 TEUs in June 2014.

Combined, total loaded imports and exports increased 14.05 percent, from 476,528 TEUs in June 2013 to 543,489 TEUs in June 2014. Factoring in empties, which increased 13.4 percent year over year, overall June 2014 volumes (736,438 TEUs) rose 13.89 percent compared to June 2013 (646,650 TEUs).

For the first six months of calendar year 2014, overall volumes (4,052,227 TEUs) have increased 9.2 percent compared to the same period in 2013. June closed out the Port’s 2013-2014 fiscal year with a total increase of 5.55 percent compared to the previous fiscal year.

Good news with one interesting footnote from DC Velocity that could account for part of the volume,

Phillip Sanfield, a port spokesman, said last month’s strong import volumes were due in part to cargo entering U.S. commerce earlier than usual ahead of a possible labor strike or management lockout at West Coast ports…Sanfield said there is no way at this time to quantify the role of labor concerns in influencing June’s traffic data. “Perhaps we’ll know more about the impact after July and August volumes come in.”

Irrespective of this potential impact, the same article reports that terminal operators expectations are, “to see an increase in the number of mega-container ships calling the port.” Here is the monthly table:

POLA TEU