In a Knowledge Worker Economy – Risk OVER the Status Quo?

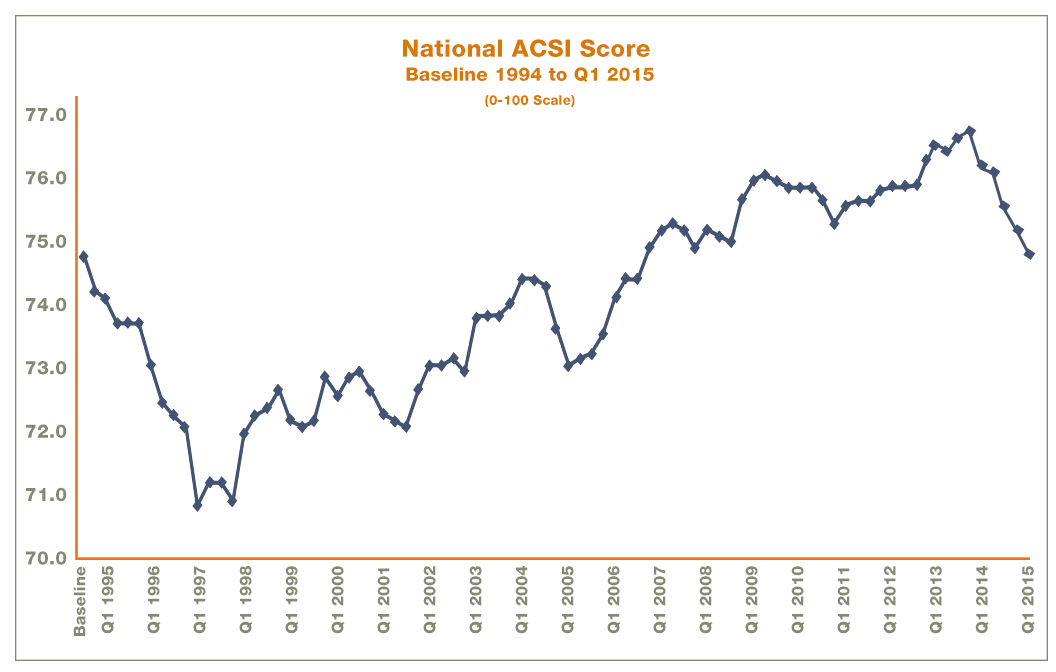
Nearly thirty years ago, Peter Drucker saw the need for and wrote of the imperative of change management within an information based, highly educated, “knowledge worker” economy and workforce:

To be sure, the fundamental task of management remains the same: to make people capable of joint performance through common goals, common values, the right structure, and the training and development they need to perform and to respond to change. But the very meaning of this task has changed, if only because the performance of management has converted the workforce from one composed largely of unskilled laborers to one of highly educated knowledge workers.

We live in a world obsessed with safety, and mitigation of risk. Inherently, there is nothing wrong with either of these elements, except for the fact that no matter how hard we try, we cannot guarantee either absolute safety or the absence of risk.

In an excellent post in the Harvard Business Review, as summarized in this morning’s Management Tip of the Day, the whole concept of risk versus safety is put to a challenge:

Most of us consider ourselves to be risk averse, but what we consider “safe” behavior often contains much more uncertainty than we suspect…The challenge is that there are very few environments that remain static. “Safe” investments like gold can lose value. You could be fired from your “safe” job. And yet we behave as if the current state will persist in perpetuity. While no one can predict the future, there are a few tactics you can use to get better at evaluating risk. Before you make a decision, do your research on all of the potential avenues of action. Ask credible experts to weigh in. And don’t forget to evaluate the inherent risk of doing nothing. Sometimes the status quo is actually riskier than taking a leap into the unknown.

Excellent advice, see the full post here. Of course, as noted above, risk must be carefully researched and thought out. To use an old word, to exercise prudence, which the Oxford English Dictionary defines as the, “ability to recognize and follow the most suitable or sensible course of action; good sense in practical or financial affairs; discretion, circumspection, caution.” In short, to exercise judgement when making a decision about the future. But too much caution, or worse, being restrained by fear amounts to the idea that we are actually in more control than we are, and that is little more than self-deception.

Hulu Expanding Skinny Options for Cord Cutters – First Step Toward True Broadcast Streaming?

A Wall Street Journal article confirms that, “Hulu is developing a subscription service that would stream feeds of popular broadcast and cable TV channels.” Although the specifics are still a way off, a couple notable highlights from the article:

    • Targeting around a $40 price point for monthly subscriptions, “Many [competing services] are seeking to deliver a subscription pay-TV package that includes a dozen or so popular channels for a price between $24.99 and $39.99”
    • Major networks are involved, “Walt Disney Co. and 21st Century Fox, which are co-owners of Hulu, are near agreements to license many of their channels for the platform…Disney’s ABC, ESPN and Disney Channel are expected to be available on the service along with the Fox broadcast network, Fox News, FX and Fox’s national and regional sports channels”

Competition is fierce, which is good for consumers as the rivals seek to hit a price point and array of options that make sense. The article notes Apple’s frustration with, “its efforts to license programming from big media companies at rates that would allow it to keep retail prices attractive to cord-cutters.”

The Implications of Policy on Public Behavior

The FRED Blog posted a very interesting dataset that illustrates the sway that public policy holds on public behavior, spending decisions and in this case, wealth preservation, “taxpayers adjusted their various income streams by trying to shift income from the beginning of 2013 to the end of 2012. This shift applies primarily to capital income.” The results are illustrated below in a customizable FRED graph:

Other comments in the post help explain the variance between two identical datasets (with the same label):

Both lines have the same title, real disposable personal income per capita, and yet they look very different. The extra careful reader will notice one series has a yearly frequency and the other has a monthly frequency. Here, frequency matters a lot, but not because of the usual concerns about seasonality. Income climbs steeply at the end of 2012 before falling dramatically in January 2013. This has to do with the so-called fiscal cliff: A series of temporary income tax cuts were set to expire on December 31, 2012, increasing the tax rate on personal income for many people in potentially significant ways.

This is quite interesting as it relates to this particular variance, but take a look at the same data from the last sixteen years:


What explains the variances showing very similar patterns? (Including a spike/cliff right in the middle of the Great Crash of 2008.) See the full post here.

Travel Adventure Roulette: Bargain Basement Prices with One Little Catch…

The Wall Street Journal reports that if you are traveling within Europe, there is an option for those looking for ultra low priced fares known as “blind bookings.” The tickets as low as $37 round trip come with one caveat: the airline chooses your destination and you only find out (to where) after your trip is booked. The parameters you are in control of are the dates, as well as an array of interests (culture, shopping, etc.), and then surprise! Find out where you are headed.

Who is Germanwings currently targeting?

For Germanwings, the cheap prices have been particularly popular with American expats and military families in Germany interested in seeing more of Europe. Jenny Crossen and her husband Bill, posted in Germany with the U.S. Army, heard about the fares from a co-worker. The couple has taken three blind-booking trips as a way to see more of Europe together. Ms. Crossen said the uncertainty was “kind of exciting while you wait for the big reveal.’’

And the article rightly questions whether such a service would work here in the States – as there are an awful lot of places that may not make for an exciting destination.

What I love about this story is how this all got started,

Blind bookings were conceived in 2007 by a university student who did a thesis on ways airlines could get more fliers without cannibalizing higher-fare ticket sales. Often when an airline launches a sale, business travelers take advantage of discounts. The student’s work included an internship at Germanwings, and his idea focused on student travel habits. “Students ask, Where could we go without paying much? They don’t care where they go, just choose,’’ said Oliver Scheid, head of revenue management and pricing at Germanwings.

This is business in the social era: customer experience, engagement, input and (indirectly) partnership with the organizations providing the product or service. See more here:

An Aging Nation: U.S. Census Interactive Graphic

Last year, the U.S. Census issued an excellent report, An Aging Nation: The Older Population in
the United States – Population Estimates and Projections and as you might guess, the findings are nothing short of alarming. Why? Because the findings in the report have a number of significant implications connected with aging in general and all its added responsibilities such as health care and social security. What’s more, the very large baby boom cohort (the report uses the traditional timespan of those born from 1946-1964) has for some time represented such a significant part of the work force, but now its rotation out of the workforce is adding to the weight of what the report labels, “older population” (defined as those above 65 years of age). Combine this with the extrapolation of the older Generation X cohort in the next few decades, plus overall mortality projections showing increased life expectancies and you have a mind boggling number of people not only meeting the definition of older, but in excess of 85 years of age.

Historical Look Using an Interactive Graphic

Below is an interactive graphic from the Census Bureau that can be used in two ways. Slide the year along the bottom for a view of the population breakdown by age at a given point in time in the last ten to fifteen years. Going back fifteen years to the year 2000, you see a very large cohort in their thirties to early fifties. As you slide the year to the right (toward the present), you see the rising age, which is somewhat self-obviating given the starting point. But then as you reach the near present, you see a surprising trend of a new cohort, now in their early twenties to early thirties, representing a significant part of the population.

Implications of the Elderly

According to the projections in the Census report:

Between 2012 and 2050, the U.S. population is projected to grow from 314 million in 2012 to 400 million in 2050, an increase of 27 percent…By 2030, more than 20 percent of U.S. residents are projected to be aged 65 and over, compared with 13 percent in 2010 and 9.8 percent in 1970.

The report identifies mortality rates as the driver of trends:

The size and composition of the older population in 2050 will be largely determined by two factors: the size and composition of the population 27 years and over in 2012 and the future course of mortality for that population. While past fertility rates were the main driver shaping the size of these cohorts to date, mortality will influence the pace at which that population declines at the older ages.

…The mortality assumptions for these population projections are guided by past trends and current levels of mortality observed in the United States and in other developed nations. Trends in health-related conditions such as smoking and obesity were also assessed.

Survivorship rates have shown improvement for many decades. In the United States, life expectancy at age 65 was 15.2 years in 1972 and rose to 19.1 years in 2010—a net gain of 3.9 years. The survival gains for those turning 85 have also been impressive. In 1972, the average time to live for someone turning 85 was 5.5 years. By 2010, this had risen to 6.5 years—a net gain of 1 year. Similar trends have been observed in almost all developed nations. For example, life expectancy at age 65 in Sweden increased from 15.7 years in 1972 to 19.8 years in 2010. Life expectancy at age 85 in Sweden increased from 4.9 years in 1972 to 6.2 years in 2010.8

There is a little bit of irony in these trends. On the one hand, you have things like the reduction of smoking that is practically guaranteed to reduce health risks and increase life span in most people. But on the other:

The incidence of obesity increased dramatically between 1980 and 2008, doubling for adults and tripling for children (National Center for Chronic Disease Prevention and Health Promotion, 2011)…The direct effect of obesity on survival is less than that for smoking, and there is evidence that the trend is leveling off. The longer-term implications are yet unknown, but could dampen continued improvements in survivorship in future years.

These trends may simply point to the advancements of medicine and technology, but as the above quote points out, the long-term implications of this fairly recent trend are yet unknown. Where is this all leading? As mentioned previously, there are significant implications for Social Security and Medicare, but these are only two examples (although the largest by far) as there are many pension and health care systems throughout the different states and regions of the U.S. There is also the continuous discussion of potential growth in the overall economy. The idea that traditional growth of 4% is not currently realistic (or possible) given the number of workers from the boomer cohort reducing labor participation rates and thus reducing spending, is a common assumption. On the other hand, the very large cohort representing a younger population as well as those in their prime working ages cannot be ignored. While it’s true that availability of workers does not produce jobs, if a number of fundamentals change in the next few years, there could be expansion that we have not seen in years. How might this match off against the implications of an aging population? One thing is certain, in the traditional sense of employment, we have not yet figured out (cumulatively) how to best utilize this large, younger cohort. And we have still not yet adjusted to a post industrial era.

American Customer Satisfaction Index and the Economy

The ACSI Measurement Model

If you are not familiar with the American Customer Satisfaction Index (ACSI), it is a unique organization that engages in “national cross-industry measure of customer satisfaction in the United States,” as well as user satisfaction with public agencies:

This strategic economic indicator is based on customer evaluations of the quality of goods and services purchased in the United States and produced by domestic and foreign firms with substantial U.S. market shares. The ACSI measures the quality of economic output as a complement to traditional measures of the quantity of economic output.

In addition to its extensive coverage of the private sector, the American Customer Satisfaction Index (ACSI) benchmarks citizen satisfaction for a multitude of federal agencies and departments, as well as two high-usage services of local governments (police and solid waste management). In 1999, the federal government selected the ACSI to be a standard metric for measuring citizen satisfaction. Now, over a decade later, ACSI coverage of federal government continues to grow. All told, the ACSI measures citizen satisfaction with over 100 services, programs, and websites of federal government agencies.

For both government and private-sector measurement, the ACSI uses customer interviews as input to a multi-equation econometric model. Customers’ responses about a government agency are aggregated to produce its ACSI benchmark, thus results are specific to each individually measured organization. Because most agencies do not deal in economic transactions in a strict sense, the ACSI government model includes outcomes appropriate to the public sector in lieu of price-related measures.

See the full ACSI benchmarks and reports for all industries (including government) here.

Why does this matter?

The most obvious use of the ACSI econometric measurements is to provide a field poll assessment of the mood of the marketplace. It almost functions like backend support for marketers. But more interesting is the potential tie to economic activity:

ACSI’s time-tested, scientific model provides key insights across the entire customer experience. ACSI results are strongly related to a number of essential indicators of micro and macroeconomic performance. At the micro level, companies that display high levels of customer satisfaction tend to have higher earnings and stock returns relative to competitors. At the macro level, customer satisfaction has been shown to be predictive of both consumer spending and gross domestic product growth (click image for enlarged view).

ACSI National Q12015

It is interesting to compare these results with a general reading of the overall economy, such as the U.S. Economy in a Snapshot by the Federal Reserve Bank of New York, where the assessment of consumer behavior is that “spending remains tepid.” This is in agreement with an article (contrarian tone) in the Investor’s Business Daily by the ACSI’s founder from earlier this year:

Despite a flurry of good economic news, the U.S. recovery, while better than just about any other country at the moment, will not gain much momentum unless there is a substantial increase in consumer demand.

Following the February jobs report, which showed better-than-expected employment growth, many economic commentators contend the economy is poised for sizable expansion in the near future, perhaps by as much as 4% or better…But neither is likely unless consumer spending strengthens substantially. In fact, spending growth probably needs to double in order for the economy to take off.

What is particularly interesting is the correlation the IBD makes to consumer satisfaction and meager wage growth. We can understand wage growth and discretionary income, but the link to consumer satisfaction may not be as easily recognizable:

Except for nondiscretionary spending, which only increases proportionally to population growth, consumers need a reason to spend and the means to do it. Recent data from the American Customer Satisfaction Index (ACSI), which measures the quality of economic output from the perspective of the user of that output, show that customer satisfaction in the U.S. is down for a fourth consecutive quarter.

It is not that consumer standards or expectations are now higher somehow. Rather, consumers are finding the shopping and consumption experience less satisfying. Too many companies have been unable to create a satisfied customer, which, according to the late Peter Drucker, is the fundamental purpose of business.

The article concludes, from a different perspective that until there is pent up consumer demand, the modest gains (at best) are what will continue.

The Marginally Attached – A Look at the Five Largest States

The U.S. Bureau of Labor Statistics (BLS) defines marginally attached in simple, straightforward language:

Marginally attached workers
Persons not in the labor force who want and are available for work, and who have looked for a job sometime in the prior 12 months (or since the end of their last job if they held one within the past 12 months), but were not counted as unemployed because they had not searched for work in the 4 weeks preceding the survey. Discouraged workers are a subset of the marginally attached.

Discouraged workers
Persons not in the labor force who want and are available for a job and who have looked for work sometime in the past 12 months (or since the end of their last job if they held one within the past 12 months), but who are not currently looking because they believe there are no jobs available or there are none for which they would qualify.

For the purpose of illustration, the FRED graph below has the top five states  selected (which accounts for more than a third of the nation’s population), showing the trend of marginally attached workers for more than a decade.

The trend lines show the inherent headwinds since the beginning of economic recovery in June 2009. The still “on the grid” numbers of the marginally attached and discouraged workers has hung on much longer than a decade ago. What’s more, six years into recovery, not one of these states has returned to its pre-recession level of the marginally attached:

Marginally Attached-Pre-Recession

This could be due in part to an aging population as well as population shifts and growth in general. This also illustrates why for so many, the recovery has not felt like a recovery. The reality is, jobs are being added as illustrated by the decreased levels of the marginally attached from the corresponding peak levels by state (peak levels were between July 2010 and October 2011):

Marginally Attached Percentage Below Peak Levels

PBS American Experience: Silicon Valley – The History, Sociology, Timing and Sometimes Luck that Started a Revolution

If you think the history of the silicon chip is a cure for insomnia, think again. Two quotes (or as close as I can remember) say it all, the first, regarding breakthroughs. “Breakthroughs historically do not just happen. They are a product of when the time is right, and the time has come for such a thing.” So on the one hand, we can strive for excellence and push for a culture of creativity and this will certainly produce positive results. But especially in the case of a radical and essential breakthrough, one that we would look back on as disruptive to a system, technology, culture or business, the convergence of events is just as important as the components driving the change.

From the PBS Introduction:

Led by physicist Robert Noyce, Fairchild Semiconductor began as a start-up company whose radical innovations would help make the United States a leader in both space exploration and the personal computer revolution, changing the way the world works, plays, and communicates. Noyce’s invention of the microchip ultimately re-shaped the future, launching the world into the Information Age.

The next quote, regarding timing and demand as they relate to the brilliance behind groundbreaking change. “Brilliant people exist all the time. It’s matching up a brilliant person in the right place, at the right time when people want what that brilliant person has to offer.” We can push and push for change or a breakthrough idea, but ultimately, the timing of that change must correspond with demand in order to harness the brilliance that will fuel the progress.

IBM’s Mysterious “Big Blue” Nickname

In honor of IBM’s conference call, I wanted to revisit the topic of the provenance of the nickname, Big Blue.

IBM's Mysterious Ubiquitous Name - Big Blue. Logo "bluing" courtesy http://howbehindwow.com/

IBM’s Mysterious Ubiquitous Name – Big Blue. Logo “bluing” courtesy http://howbehindwow.com/

I like urban legends not because they are believable, but because of what they say about human nature and sociology. Urban legends are also amusing not necessarily to believe, but they are fun to engage in (as if to believe) the idea of them being true, such as us humans ingesting eight spiders per year in our sleep.

A search for the provenance of the name Big Blue turns up very little historical documentation. Some say the term was first used in the early 1980’s, with the self-obviating point of the adjective big. But that doesn’t explain much. There are plenty of organizations with significant size, extent, influence, market share or intensity, and we don’t automatically add big to their description. The blue part seems to have no plausible theories at all. I have tried in vain to find the origins of this name, as I found myself instinctively using it years ago before ever realizing it was an ubiquitous nickname. I searched Google Books for the term and have been able to move the date back to 1975 with this mention. But the truth is, no one really knows the origin, including IBM:

How did IBM get its distinctive nickname, “Big Blue?” While the name came about organically, with no known single source, the first official reference in print to IBM as “Big Blue” was in BusinessWeek magazine:

“No company in the computer business inspires the loyalty that IBM does, and the company has accomplished this with its almost legendary customer service and support … As a result, it is not uncommon for customers to refuse to buy equipment not made by IBM, even though it is often cheaper. ‘I don’t want to be saying I should have stuck with the “Big Blue,”’ says one IBM loyalist. ‘The nickname comes from the pervasiveness of IBM’s blue computers’” (No. 1’s Awesome Strategy, BusinessWeek, June 8, 1981).

So there you have it. Isn’t that great, kind of mysterious and interesting? Or at least, it’s fun to engage in any of the possible explanations.