Planning for the Coming Year: Confidence Through Perspective

It’s easy to look back at a previous year and focus on what could have gone better, how different decisions may have affected outcomes to the good, or even how we may feel stuck in one way or another. As with many, I share the view that a new year is an excellent time to make or update goals, modify plans or start a strategic course of action for the upcoming year. This could be as simple as a reading list, a habit change, or a significant life changing decision. Either way, I think outlook and perspective can be a key driver in making this a positive exercise, whether reflecting or planning.

One of the benefits of experience is long-term perspective. I used to have promotional poster from a brokerage firm that read, “confidence through perspective.” Within the poster there was a montage of pictures, dates, graphic measurements and major event annotations. The idea being, when you look at current events with too much granularity, you may lose focus on an overall perspective on how things may turn out, given a certain trajectory, determination, diligence, planning, hard work, and a little more time. But at the same time, if we fail to look carefully, and with the proper focus, we may miss some of the obvious details right in front of us. For reflection purposes, consider the words from Henry David Thoreau’s Journal, June 10, 1853, titled, Looking through a Spy-Glass:

Source: http://www.concordmuseum.org/spyglass.php

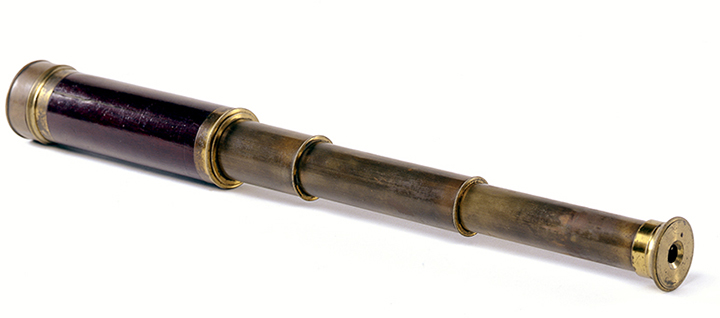
I amused myself yesterday afternoon with looking from my window, through a spy-glass, at the tops of the woods in the horizon. It was pleasant to bring them so near and individualize the trees, to examine in detail the tree-tops which before you had beheld only in the mass as the woods in the horizon. It was an exceedingly rich border, seen thus against, and the imperfections in a particular tree-top more than two miles off were quite apparent. I could easily have seen a hawk sailing over the top of the wood, and possibly his nest in some higher tree. Thus to contemplate, from my attic in the village, the hawks circling about their nests above some dense forest or swamp miles away, almost as if they were flies on my own premises! I actually distinguished a taller white pine with which I am well acquainted, with a double top rising high above the surrounding woods, between two and three miles distant, which, with the naked eye, I had confounded with the nearer woods.

All of that from the view from an attic window, because the author took the time to look, focus and reflect. When you consider the outlook for this year and take time to think and plan, hear the words of my great hero, C. S. Lewis, “Mere change is not growth. Growth is the synthesis of change and continuity, and where there is no continuity there is no growth.”

Image Source: http://www.concordmuseum.org/spyglass.php

Historical Trend of Retail Sales

Today’s Advance Monthly Sales for Retail and Food Services (12/2015) supports the anecdotal activity that many are observing: modest but forward movement. And good news is good news, perhaps especially this far into expansion. A look at retail sales growth excluding autos shows about 26% growth over the long haul of this economic expansion:

Given the shift of what drives our economy, we know that this is a very significant measurement (see Retail: The Front Page of our Economy). But other factors continue to be at work as noted in a post on Barron’s, The North Star of the Economy:

Chronologically, this expansion is old. It has now lasted into its 77th month, making it the fifth longest of the 34 expansions since 1900. Looking at light-vehicle sales, at over 18 million units annualized in each of the last two months, we should be close to a peak. Housing starts, however, remain well below their long-term averages, suggesting years of expansion to come, while interest rates and inflation are at levels normally associated with early expansion. Moreover, all of these measures are severely distorted by extremely aggressive monetary easing.

However, there is one “North Star” variable that has behaved in almost the same way in all modern expansions, namely, the unemployment rate….The November employment report confirmed that the unemployment rate has now been falling for six years at a steady pace of 0.8% per year and has now declined to 5.0%. Slow labor force growth and steady economic growth suggests a continuation of this pace, which would put the unemployment rate at 4.2% in November of 2016 and 3.8% in the spring of 2017.

With these measurements of employment, it is interesting that consumer behavior has not snapped back at the same pace as in previous recoveries. For example, compare the same data during the expansion cycle after the brief recession following the dot-com correction:

Now look at the blistering pace for the previous decade:

Notice the decline (or less steepness) with each recovery cycle? Put another way, the percentage increases for the above three cited time spans of expansion is (beginning): 1992: 61%, 2001: 41%, 2006: 26%.

Sluggish Wage Growth, Trend or Cycle?

The suggestion that wages have not kept time with costs, even as unemployment has continued to decline is unlikely to surprise anyone, such as the following commentary in the Economist:

Low unemployment means that employers have to try harder to find new workers, while existing workers can threaten to move elsewhere. As a result, workers should be able to demand higher wages. Yet firms in America seem not to have got the message. Inflation-adjusted wages for typical workers are stagnant. In fact, they have barely grown in the past five years; average hourly earnings rose 2% year-on-year in February of 2015: about the same as in February of 2010.

FRED demonstrates this same wage data as a trend, that since the 1980’s has diverged from GDP. The graph below shows the same data as comparative indexes where “it’s immediately apparent that the GDP figure is now higher than wages, meaning that it has grown faster since the 1980s:”

The post notes this caveat when trying to aggregate wages:

It’s not totally obvious how we should define wages—because wage dynamics change so much over the distribution. Low, medium, and high wages have grown at different rates and at different times. From a macroeconomic perspective, however, it makes some sense to measure the average wage. The effect of so doing is that we put more weight on the higher earners than the average person, a result of a positively skewed wage distribution. (Recall the definition of skewness: Here, it means the top tail can pull up the mean past the average person’s wage, the median wage.)

But why? According to the same post, both GDP and BLS data “plummeted in the Great Recession, but since then have been growing at about the same pace. The decline in wages as a fraction of GDP is not a result of a sluggish recovery from the Great Recession, but rather from effects predating it.” This still does not explain why, but more or less, what has happened. Again, the same post in the Economist suggests a “wage hangover,” where “firms preferred to return to more normal management conditions, and to let too-high wages adjust over time: “pent-up” wage cuts have been achieved simply by not granting raises. Wages, in other words, are not rising by more because in many cases they are already too high.” Wow! That is so simple yet reasonable, it may very well be a significant factor contributing to this trend. Another factor cited is what many of us know anecdotally as well as from the data: “part-time for economic reasons” and other forms of un- or under employment.

Travel Adventure Roulette: Bargain Basement Prices with One Little Catch…

The Wall Street Journal reports that if you are traveling within Europe, there is an option for those looking for ultra low priced fares known as “blind bookings.” The tickets as low as $37 round trip come with one caveat: the airline chooses your destination and you only find out (to where) after your trip is booked. The parameters you are in control of are the dates, as well as an array of interests (culture, shopping, etc.), and then surprise! Find out where you are headed.

Who is Germanwings currently targeting?

For Germanwings, the cheap prices have been particularly popular with American expats and military families in Germany interested in seeing more of Europe. Jenny Crossen and her husband Bill, posted in Germany with the U.S. Army, heard about the fares from a co-worker. The couple has taken three blind-booking trips as a way to see more of Europe together. Ms. Crossen said the uncertainty was “kind of exciting while you wait for the big reveal.’’

And the article rightly questions whether such a service would work here in the States – as there are an awful lot of places that may not make for an exciting destination.

What I love about this story is how this all got started,

Blind bookings were conceived in 2007 by a university student who did a thesis on ways airlines could get more fliers without cannibalizing higher-fare ticket sales. Often when an airline launches a sale, business travelers take advantage of discounts. The student’s work included an internship at Germanwings, and his idea focused on student travel habits. “Students ask, Where could we go without paying much? They don’t care where they go, just choose,’’ said Oliver Scheid, head of revenue management and pricing at Germanwings.

This is business in the social era: customer experience, engagement, input and (indirectly) partnership with the organizations providing the product or service. See more here:

Leading Indicators for the FRB of Richmond: Manufacturing Sector Activity Slowed; New Orders Flattened, Shipments Decreased

Each month the Richmond Federal Reserve Survey of Manufacturing Activity is sent out to 220 firms in an attempt to form a profile of its district, with about 100 respondents:

Respondents provide information on current activity, including shipments, new orders, order backlogs, and inventories. In addition, manufacturers inform us about employment conditions, prices and their expectations of business activity for the next six months. The summary results of each survey are provided to the public on the fourth Tuesday of the month.

According to Moody’s:

The diffusion indexes are calculated as the percentage of respondents reporting improvement minus the percentage reporting deterioration. Each diffusion index ranges from -100 to 100, where positive values correspond with increased activity from the prior month. An index level of zero indicates that a particular measure, such as new orders, was unchanged from the prior month. The data are also seasonally adjusted.

They also provide a good overview of the benefits and limitations of the survey, and what might be most helpful:

What to look for

      • The shipments index provides a good snapshot of demand conditions.
      • The employment index shows the manufacturing sector’s effect on the region’s labor market.
      • Of all the components of the survey, the new orders index is the best leading indicator.
      • The expected employment index gives an indication of what hiring trends will be over the next few months.

Strengths

      • Timeliness.
      • The survey includes a wide variety of indicators of the manufacturing sector’s health, including shipments, new orders, unfilled orders, and employment.
      • The survey provides an excellent overview of current manufacturing conditions in the Federal Reserve’s Fifth District.
      • The new orders index and the unfilled orders index are good leading indicators of manufacturing activity.

Weaknesses

      • Strikes or other temporary factors can sometimes create large changes from month to month.

This month’s survey showed a mixed bag of opinions, including fairly soft responses, yet optimistic expectations:

Fifth District manufacturing activity slowed in August, according to the most recent survey by the Federal Reserve Bank of Richmond. Shipments and order backlogs decreased, while new orders flattened this month. Manufacturing hiring softened this month; however, average wages continued to increase at a moderate pace. Prices of raw materials rose more slowly in August, while prices of finished goods grew slightly faster compared to last month.

Despite the soft current conditions, producers remained optimistic about future business conditions. Expectations were for solid increases in shipments and in the volume of new orders in the six months ahead, with increased capacity utilization. In addition, manufacturers looked for rising backlogs and longer vendor lead times.

Below is a graphic look at each category for the last ten years, each measured in August (click image for full size; also note, zero shows no bar, such as Volume of New Orders in Aug-2015):

2015-08-25-5th District Survey

Below are a few other highlights spanning a ten-year trend (click image to enlarge):

10-Year Trend

2015-08-25-5th District Survey Shipments2015-08-25-5th District Survey Finished Goods

Fed Chairwoman: Trying to Build Consensus Among Disparate Views on Policy

Even with all the discussion of the implications of China’s Move to Devalue the Yuan, it has been widely accepted that a policy of firming easy money would probably still move forward. But this could prove more challenging for the Fed given the variegated opinions among policy makers:

Officials have signaled for months they intend to start raising short-term rates from near-zero interest before year-end. But they have provided no clear sign of having settled on whether to move at their next policy meeting Sept. 16-17. Minutes of their July 28-29 meeting, released Wednesday, underscored why the decision remains a close call.

“Most [officials] judged that the conditions for policy firming had not yet been achieved, but they noted that conditions were approaching that point,” the minutes said.

That passage might be read as a hint that officials saw a September rate increase in the cards, but the minutes showed officials had wide-ranging views about taking that step and several notable sources of trepidation.

The Fed has said it won’t move rates until it is more confident inflation will rise toward its 2% target after running below it for more than three years. “Some participants expressed the view that the incoming information had not yet provided grounds for reasonable confidence that inflation would move back to 2 percent over the medium term,” the minutes said.

The conundrum is self obviating: move too fast, and you are going to tank this forward moving, but tepid recovery. Do nothing, and you might have fueled yet another bubble. And there are voices calling for action citing the need for credibility, confidence and timing, others, for caution:

Other developments are giving Fed officials new reason for caution. At the July meeting they noted China’s stock-market declines; since then Chinese officials have allowed their currency to depreciate, a new source of concern about the growth outlook in the world’s second largest economy.

U.S. crude oil prices hit a six-year low Wednesday and U.S. stocks tumbled, boosting demand for ultrasafe U.S. government debt. The yield on the benchmark 10-year Treasury note fell to 2.129% from 2.196% on Tuesday and marks the yield’s lowest closing level since May 29. A gauge of 10-year inflation expectations in the bond market fell to the lowest level since January.

So back to the conundrum. Wait and by implication, call into question the health of the U.S. economy, or move forward and see if the economy “would be able to absorb higher interest rates and that inflation was moving toward the committee’s objective.” That’s life in the big chair.

WSJ: A yuan for your thoughts, Janet?

Last week saw a whole array of opinions, outrage (misguided, genuine or contrived) and interminable commentary on the implications of China’s actions earlier last week while still maintaining the status of [just shy of] currency manipulators by the U.S. executive branch. Earlier this week in the Journal, China Moves to Devalue Yuan:

China’s yuan has been on an upward track for a decade, during which the country’s economy grew to be the second largest in the world and the currency gained importance globally. The devaluation Tuesday was the most significant downward adjustment to the yuan since 1994, when as part of a break from Communist state planning, Beijing let the currency fall by one-third.

China sets a midpoint for the value of the yuan against the U.S. dollar. In daily trading, the yuan is allowed to move 2% above or below that midpoint, which is called the daily fixing. But the central bank sometimes ignores the daily moves, at times setting the fixing so that the yuan is stronger against the dollar a day after the market has indicated it should be weaker.

With Tuesday’s move, the fixing will now be based on how the yuan closes in the previous trading session. As a result, the yuan’s fixing was weakened by 1.9% Tuesday from the previous day, leaving it at 6.2298 to the U.S. dollar, compared with 6.1162 on Monday. The yuan dropped as much as 1.99% from its previous close to 6.3360 against the dollar in Shanghai and fell as much as 2.3% in Hong Kong in early trading.

Ironically, this move was ostensibly to allow the market to play a greater role in the value of China’s currency. But contra to this view:

“The real proof in whether this change is about reform or growth will come when authorities resist the urge to intervene down the road when another policy goal that could be achieved by a significant revaluation or devaluation comes knocking,” said Scott Kennedy, an analyst at the Center for Strategic & International Studies, a Washington think tank.

“China wasn’t able to resist that urge on the stock market, so the government doesn’t get the benefit of the doubt on this quite yet,” Mr. Kennedy said, a reference to China’s recent moves to prevent further declines in its equities markets.

What about Inflation?

In an opinion post, Rate Watchers Read the Chinese Tea Leaves, the authors makes an interesting point regard another variable that could complicate matters:

Speaking before and after the step, respectively, Atlanta and New York Federal Reserve Bank presidents Dennis Lockhart and William Dudley cast doubt on the notion that run-of-the mill macroeconomic turbulence would delay a September increase. And a survey of 60 economists by The Wall Street Journal conducted mostly before China’s bombshell showed that 82% expected an increase next month.

But what about its effect, at the margin, on a critical set of U.S. economic data? Namely, inflation. Friday’s producer-price index and Wednesday’s consumer-price index will be the penultimate readings before the big decision.

…With markets recovering somewhat from the shock, China’s move probably won’t delay a September hike. But its contribution to slower price gains overall could slow the pace of Fed tightening.

 See more analysis here:


Fed Capital Requirements: Bearing the Cost that Failure Would Impose on Others

Too big to fail is a narrowing option. And running with riskier assets is going to be costly for larger banking institutions, according to new rules by Federal Reserve as noted in the Wall Street Journal:

The Fed completed one rule stating that the eight largest banks in the country should maintain an additional layer of capital to protect against losses, its plainest effort yet to encourage them to shrink. At the same time, it offered a reprieve to General Electric Co.’s finance unit from more-intensive regulation, after the company promised to cut its assets by more than half.

…Regulators have pushed big banks to expand their capital buffers to better absorb losses, reduce their reliance on volatile forms of funding, improve their risk management and cut back on risky assets. So-called stress tests measure banks’ resilience each year and can restrict shareholder payouts at firms that don’t pass.

For Wall Street banks and their investors, the emerging regime presents a series of choices: specifically whether to pay the cost of new regulation, which will fall to the bottom line, or change their business models by shedding businesses or withdrawing from certain markets, such as owning commodities.

In a quote that I think is one of the best commentaries on the subject,

Fed Chairwoman Janet Yellen, before voting to approve the new measure, said financial firms must “bear the costs that their failure would impose on others.” She offered banks the choice of maintaining more capital to reduce the chance they would fail, or get smaller and reduce the harm their failure would have on the financial system.

The big banks of course object to the action stating that it will remove billions from the economy. Below is a graph of the big 8 that will be hit with he most significant requirements (click for larger image):

Bigger Buffer

But it is not size along that determines how each bank will be assessed, “the size of each bank’s additional capital requirement is tailored to the firm’s relative riskiness, as measured by the Fed’s formula, which considers factors such as size, entanglements with other firms and internal complexity. As those factors shrink or grow, so will a bank’s surcharge.”

An Aging Nation: U.S. Census Interactive Graphic

Last year, the U.S. Census issued an excellent report, An Aging Nation: The Older Population in
the United States – Population Estimates and Projections and as you might guess, the findings are nothing short of alarming. Why? Because the findings in the report have a number of significant implications connected with aging in general and all its added responsibilities such as health care and social security. What’s more, the very large baby boom cohort (the report uses the traditional timespan of those born from 1946-1964) has for some time represented such a significant part of the work force, but now its rotation out of the workforce is adding to the weight of what the report labels, “older population” (defined as those above 65 years of age). Combine this with the extrapolation of the older Generation X cohort in the next few decades, plus overall mortality projections showing increased life expectancies and you have a mind boggling number of people not only meeting the definition of older, but in excess of 85 years of age.

Historical Look Using an Interactive Graphic

Below is an interactive graphic from the Census Bureau that can be used in two ways. Slide the year along the bottom for a view of the population breakdown by age at a given point in time in the last ten to fifteen years. Going back fifteen years to the year 2000, you see a very large cohort in their thirties to early fifties. As you slide the year to the right (toward the present), you see the rising age, which is somewhat self-obviating given the starting point. But then as you reach the near present, you see a surprising trend of a new cohort, now in their early twenties to early thirties, representing a significant part of the population.

Implications of the Elderly

According to the projections in the Census report:

Between 2012 and 2050, the U.S. population is projected to grow from 314 million in 2012 to 400 million in 2050, an increase of 27 percent…By 2030, more than 20 percent of U.S. residents are projected to be aged 65 and over, compared with 13 percent in 2010 and 9.8 percent in 1970.

The report identifies mortality rates as the driver of trends:

The size and composition of the older population in 2050 will be largely determined by two factors: the size and composition of the population 27 years and over in 2012 and the future course of mortality for that population. While past fertility rates were the main driver shaping the size of these cohorts to date, mortality will influence the pace at which that population declines at the older ages.

…The mortality assumptions for these population projections are guided by past trends and current levels of mortality observed in the United States and in other developed nations. Trends in health-related conditions such as smoking and obesity were also assessed.

Survivorship rates have shown improvement for many decades. In the United States, life expectancy at age 65 was 15.2 years in 1972 and rose to 19.1 years in 2010—a net gain of 3.9 years. The survival gains for those turning 85 have also been impressive. In 1972, the average time to live for someone turning 85 was 5.5 years. By 2010, this had risen to 6.5 years—a net gain of 1 year. Similar trends have been observed in almost all developed nations. For example, life expectancy at age 65 in Sweden increased from 15.7 years in 1972 to 19.8 years in 2010. Life expectancy at age 85 in Sweden increased from 4.9 years in 1972 to 6.2 years in 2010.8

There is a little bit of irony in these trends. On the one hand, you have things like the reduction of smoking that is practically guaranteed to reduce health risks and increase life span in most people. But on the other:

The incidence of obesity increased dramatically between 1980 and 2008, doubling for adults and tripling for children (National Center for Chronic Disease Prevention and Health Promotion, 2011)…The direct effect of obesity on survival is less than that for smoking, and there is evidence that the trend is leveling off. The longer-term implications are yet unknown, but could dampen continued improvements in survivorship in future years.

These trends may simply point to the advancements of medicine and technology, but as the above quote points out, the long-term implications of this fairly recent trend are yet unknown. Where is this all leading? As mentioned previously, there are significant implications for Social Security and Medicare, but these are only two examples (although the largest by far) as there are many pension and health care systems throughout the different states and regions of the U.S. There is also the continuous discussion of potential growth in the overall economy. The idea that traditional growth of 4% is not currently realistic (or possible) given the number of workers from the boomer cohort reducing labor participation rates and thus reducing spending, is a common assumption. On the other hand, the very large cohort representing a younger population as well as those in their prime working ages cannot be ignored. While it’s true that availability of workers does not produce jobs, if a number of fundamentals change in the next few years, there could be expansion that we have not seen in years. How might this match off against the implications of an aging population? One thing is certain, in the traditional sense of employment, we have not yet figured out (cumulatively) how to best utilize this large, younger cohort. And we have still not yet adjusted to a post industrial era.

American Customer Satisfaction Index and the Economy

The ACSI Measurement Model

If you are not familiar with the American Customer Satisfaction Index (ACSI), it is a unique organization that engages in “national cross-industry measure of customer satisfaction in the United States,” as well as user satisfaction with public agencies:

This strategic economic indicator is based on customer evaluations of the quality of goods and services purchased in the United States and produced by domestic and foreign firms with substantial U.S. market shares. The ACSI measures the quality of economic output as a complement to traditional measures of the quantity of economic output.

In addition to its extensive coverage of the private sector, the American Customer Satisfaction Index (ACSI) benchmarks citizen satisfaction for a multitude of federal agencies and departments, as well as two high-usage services of local governments (police and solid waste management). In 1999, the federal government selected the ACSI to be a standard metric for measuring citizen satisfaction. Now, over a decade later, ACSI coverage of federal government continues to grow. All told, the ACSI measures citizen satisfaction with over 100 services, programs, and websites of federal government agencies.

For both government and private-sector measurement, the ACSI uses customer interviews as input to a multi-equation econometric model. Customers’ responses about a government agency are aggregated to produce its ACSI benchmark, thus results are specific to each individually measured organization. Because most agencies do not deal in economic transactions in a strict sense, the ACSI government model includes outcomes appropriate to the public sector in lieu of price-related measures.

See the full ACSI benchmarks and reports for all industries (including government) here.

Why does this matter?

The most obvious use of the ACSI econometric measurements is to provide a field poll assessment of the mood of the marketplace. It almost functions like backend support for marketers. But more interesting is the potential tie to economic activity:

ACSI’s time-tested, scientific model provides key insights across the entire customer experience. ACSI results are strongly related to a number of essential indicators of micro and macroeconomic performance. At the micro level, companies that display high levels of customer satisfaction tend to have higher earnings and stock returns relative to competitors. At the macro level, customer satisfaction has been shown to be predictive of both consumer spending and gross domestic product growth (click image for enlarged view).

ACSI National Q12015

It is interesting to compare these results with a general reading of the overall economy, such as the U.S. Economy in a Snapshot by the Federal Reserve Bank of New York, where the assessment of consumer behavior is that “spending remains tepid.” This is in agreement with an article (contrarian tone) in the Investor’s Business Daily by the ACSI’s founder from earlier this year:

Despite a flurry of good economic news, the U.S. recovery, while better than just about any other country at the moment, will not gain much momentum unless there is a substantial increase in consumer demand.

Following the February jobs report, which showed better-than-expected employment growth, many economic commentators contend the economy is poised for sizable expansion in the near future, perhaps by as much as 4% or better…But neither is likely unless consumer spending strengthens substantially. In fact, spending growth probably needs to double in order for the economy to take off.

What is particularly interesting is the correlation the IBD makes to consumer satisfaction and meager wage growth. We can understand wage growth and discretionary income, but the link to consumer satisfaction may not be as easily recognizable:

Except for nondiscretionary spending, which only increases proportionally to population growth, consumers need a reason to spend and the means to do it. Recent data from the American Customer Satisfaction Index (ACSI), which measures the quality of economic output from the perspective of the user of that output, show that customer satisfaction in the U.S. is down for a fourth consecutive quarter.

It is not that consumer standards or expectations are now higher somehow. Rather, consumers are finding the shopping and consumption experience less satisfying. Too many companies have been unable to create a satisfied customer, which, according to the late Peter Drucker, is the fundamental purpose of business.

The article concludes, from a different perspective that until there is pent up consumer demand, the modest gains (at best) are what will continue.