Fog of Business War Turns to the Skills Sets of Generals as Leaders

With so much emphasis on how to reach millennials and the superiority of sitting around cross-legged on the floor of an open office design, it might seem odd that high-level military experience is sought after for leadership, but should it? From the Wall Street Journal, Generals Bring Battlefield Expertise to the Business World:

In the fog of war, and in peacetime, generals are trained to anticipate unknown risks, build high-functioning teams and make quick, strategic decisions in high-pressure situations. “They are the same traits necessary in the fog of business,” says Henry Stoever, a captain in the Marine Corps who is now chief marketing officer of the National Association of Corporate Directors.

…Companies, especially those in crisis, covet the reputational boost that comes from seeking the counsel of a former military leader, says Wendy Monsen, president of executive recruiter Korn/Ferry ’s federal-government practice. Whereas more than three-quarters of Americans trust the military to act in the public’s interest, according to a 2016 Pew Research Center survey, only 41% feel the same way about business leaders.

What is surprising to learn is that the leadership styles do not reflect the command and control caricature that we might think, “Rather than barking orders and enforcing hierarchy, military leaders who succeed in the corporate world know how to coax different groups into collaborating, says retired Army Maj. Gen. Michael J. Diamond, an organizational leadership consultant.”

In other words, these backgrounds not only bring the strength of strategic vision and experience but character and leadership traits that are associated with the most effective and successful leaders, such as emotional intelligence, the ability to collaborate and getting others to cooperate. Not to mention a keen understanding of risk assessment. See the full article here.

CEPR: Dodd-Frank’s Seventh Birthday – Will It Be Around to Celebrate Its Eighth?

CEPR economist Eileen Appelbaum gives a concise overview of some of the implications of the Dodd-Frank Act, which may not see its 8th year:

As memories of the great recession and financial crisis fade, the landmark financial reform law passed seven years ago today, in the aftermath of that economic disaster, is on the chopping block. A Republican Congress and the Republican President are intent on rolling back the provisions of the Dodd-Frank Wall Street Reform and Consumer Protection Act that have increased transparency and limited risk in our financial system. The Financial Choice Act, first introduced in Congress in 2016 by Texas Representative Jeb Hensarling, is poised for a comeback.

…Key provisions slated to be rolled back are those that kept private equity funds and hedge funds out of the shadows. In the first 30-plus years of their existence as major financial actors, private funds were able to structure themselves in ways that exempted them from the many laws designed to protect investors and enabled them to avoid regulatory scrutiny by the Securities and Exchange Commission (SEC). Dodd-Frank introduced oversight and regulation that has been a boon to investors in private equity. Now, Section 858 of the CHOICE Act proposes once again exempting private equity fund advisors from registration and reporting requirements. It states, “no investment adviser shall be subject to the registration or reporting requirements of this title with respect to the provision of investment advice relating to a private equity fund.”

See the full post here with links to peer reviewed articles and helpful background information including SEC actions.

FRED Blog: Healthcare Inflation vs. General CPI

In an interesting post from the FRED Blog, Healthy inflation? Inflation in the healthcare industry vs. general CPI, a comparison is set up between elements of the consumer price index, versus the rate of rising costs related to healthcare. The authors point out (what most of us have known for decades) that medical care has risen faster than the other components in the CPI basket:

Going back as far as the series are available, since 1948, the price of medical care has grown at an average annual rate of 5.3% while the entire basket, headline CPI, has grown at an average annual rate of 3.5%. In the past 20 years, in the regime of stable inflation, headline CPI has grown at an average annual rate of 2.2%, whereas the price level of medical care has grown at an average annual rate of 3.6%—about 70% faster.

The post continues addressing why this matters, beyond the obvious and anecdotal, namely, policy implications, impact to the average consumer, retirees and those with stagnant wages:

The implication of these two features is far reaching: It’s symptomatic of the increasing share of income the U.S. spends on medical care. Beyond macro trends, the features of these two series themselves have policy implications. Indeed, indexing government healthcare budgets to overall CPI rather than medical care prices has implications for spending in real terms. This gap could also widen during recessions, when government help may be most in demand.

This does not bode well given current policy discussions, as noted in the Wall Street Journal, “any replacement health plan that satisfied GOP conservatives was likely to be opposed by the party’s centrists, and vice versa.” See the full FRED post here.

Mathematical Sweet Spot of the Wave? Right Inside…

Well, I guess we just figured out who won the lottery for the coolest postdoctoral work in existence…from Scripps Institution of Oceanography:

For surfers, finding the “sweet spot,” the most powerful part of the wave, is part of the thrill and the challenge.

Nick Pizzo, a Scripps Institution of Oceanography at the University of California postdoctoral researcher, has found the exact location on the wave where a surfer gains the greatest speed to get the best ride.

In a study published this month online in the Journal of Fluid Mechanics, Pizzo applied principles of physics at the ocean’s surface—where air and water meet—to study how energy is transferred from the underlying wave to a particle on the surface, in this case, a surfer.

“Based upon the speed and geometry of the wave, you can determine the conditions to surf a wave and also where on the wave the maximum acceleration, or ‘sweet spot,’ will be located,” said Pizzo, the author of the National Science Foundation and Office of Naval Research-funded paper and an avid surfer.

Pizzo and fellow researchers in the Air-Sea Interaction Laboratory at the Scripps Marine Physical Laboratory and Climate, Atmospheric Sciences, and Physical Oceanography division are studying the mass, momentum, and energy exchanged between the atmosphere and ocean due to breaking waves, to help improve our understanding of weather and climate.

As a wave breaks at the ocean surface, currents are generated and water droplets in the form of sea spray are ejected from the ocean into the atmosphere. These small-scale processes are critical pieces of information to improve weather and climate models to better forecast major storm events and the future climate.


If you really want to be inspired, this work was made possible by grants. Specifically, the Collaborative Research: A Lagrangian Description of Breaking Ocean Surface Waves from Laboratory Measurements and Stochastic Parameterizations. From the abstract:

The goal of this collaborative research is to build a stochastic Lagrangian parameterization of surface wave breaking that can subsequently be applied to wave and ocean modeling. The students and postdoctoral researchers employed in this project will gain experience in the disciplines of science, technology, engineering and mathematics (STEM). The data and breaking parameterization developed here will subsequently find direct application in atmosphere and ocean modeling.

 The following articles were the output of this research:

Deike, L., Popinet, S. & Melville,W.K.. “Capillary effects on wave breaking,” Journal of Fluid Mechanics, v.769, 2015, p. 541.

Deike, L., Melville, W.K. & Popinet, S.. “Air entrainment and bubble statistics in three dimensional breaking waves,” Journal of fluid mechanics, v.801, 2015, p. 91.

N. Pizzo, L. Deike and W.K. Melville. “Current generation by deep-water breaking waves.,” Journal of Fluid Mechanics, v.803, 2016, p. 275.

See also a post on this subject from the U-Cal site.

Motor Intelligence June 2017 Auto Sales

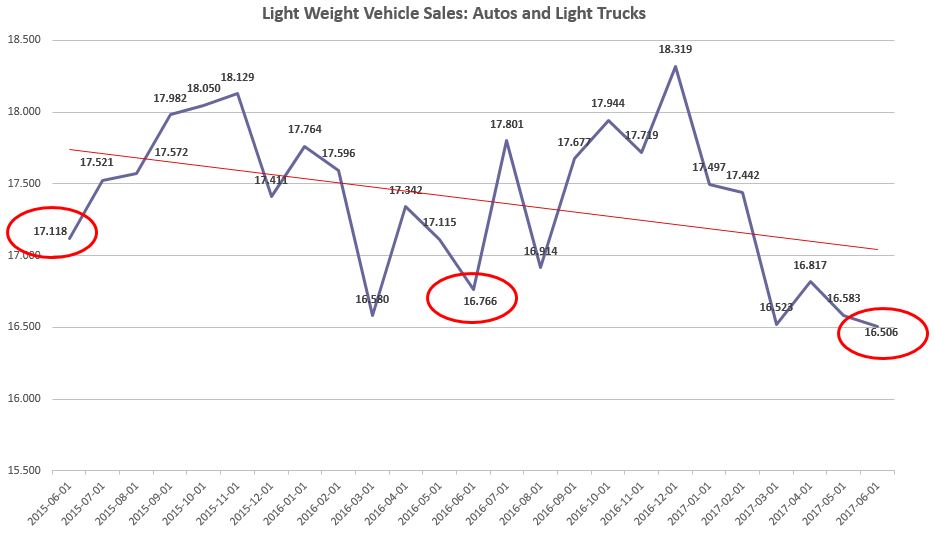
Earlier this week MotorIntelligence released its update and SAAR data. As expected, sales are somewhat reduced on a year-over-year basis:

ALTSales 2017 06

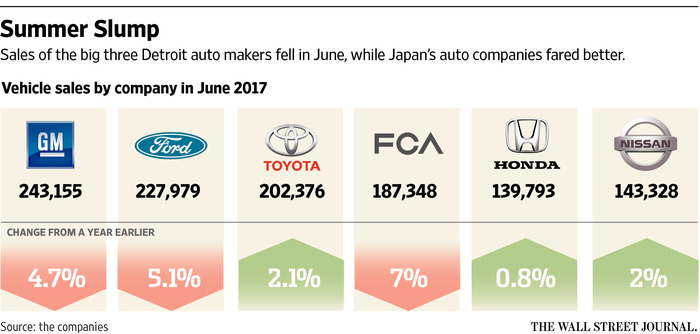
Most notably, the seasonally adjusted annual rates for autos are continuing to fall with truck sales continuing to post positive results for most manufacturers – Nissan with a whopping 21% + year-over-year truck sales with an additional 73,186 units sold over the prior year (though the company’s total car sales are off almost 12%). The Wall Street Journal cites that part of the reason for reduced sales is due to fewer vehicles being sent to rental companies:

The move away from rental sales reinforces a newfound discipline for domestic players that have been riding a seven-year growth streak since GM and Chrysler sought bankruptcy protection in 2009. The Detroit 3 reported tens of billions in profits during that span, bolstered by tailwinds from falling gas prices and surging demand for profit-rich trucks and SUVs.

Overall industry demand softened over the first half of 2017, however, falling about 2% through six months, according to JD Power. The development ushers in an expected plateau for auto sales, an important driver for the broader U.S. economy.

The fleet-sales pullback is having a disproportionate impact on wider volumes. Sales to retail customers at dealerships is down less than 1%, but sales to non-retail customers such as government fleets, commercial buyers and rental-car companies is off 7.8%, according to JD Power.

WSJ Summer Slump

 As mentioned previously, this was not unexpected given the volume of auto sales in the last three years that have extended beyond most expectations. Auto manufacturers seem to be signaling more slowdowns as the New York Times reports:

Automakers said this week that sales dropped in June for a sixth consecutive month, falling by 3 percent from a year ago, a trend that analysts do not see letting up anytime soon. And as demand falls, there is less work in the nation’s auto-assembly plants — primarily those that build traditional passenger cars…scaling back jobs in car plants is part of a newfound discipline among automakers to avoid bloated payrolls and inventories when sales start slipping.

While this trend is not all that alarming, two things are worth noting in this “post peak” period, both related to the financing of new vehicles and leases. The first is from Edmonds.com, where based on their analysis:

The average loan term for new vehicles soared to a record high of 69.3 months in June, an increase of 1 percent from June 2016 and up 6.8 percent from five years ago. In addition, the average amount financed by new-car buyers jumped to $30,945, which is a 2.6 percent increase from this time last year and 17.2 percent more than five years ago. And the average monthly car payment is now $517: That’s 2.1 percent more than in June 2016 and an 11.3 percent increase over five years.

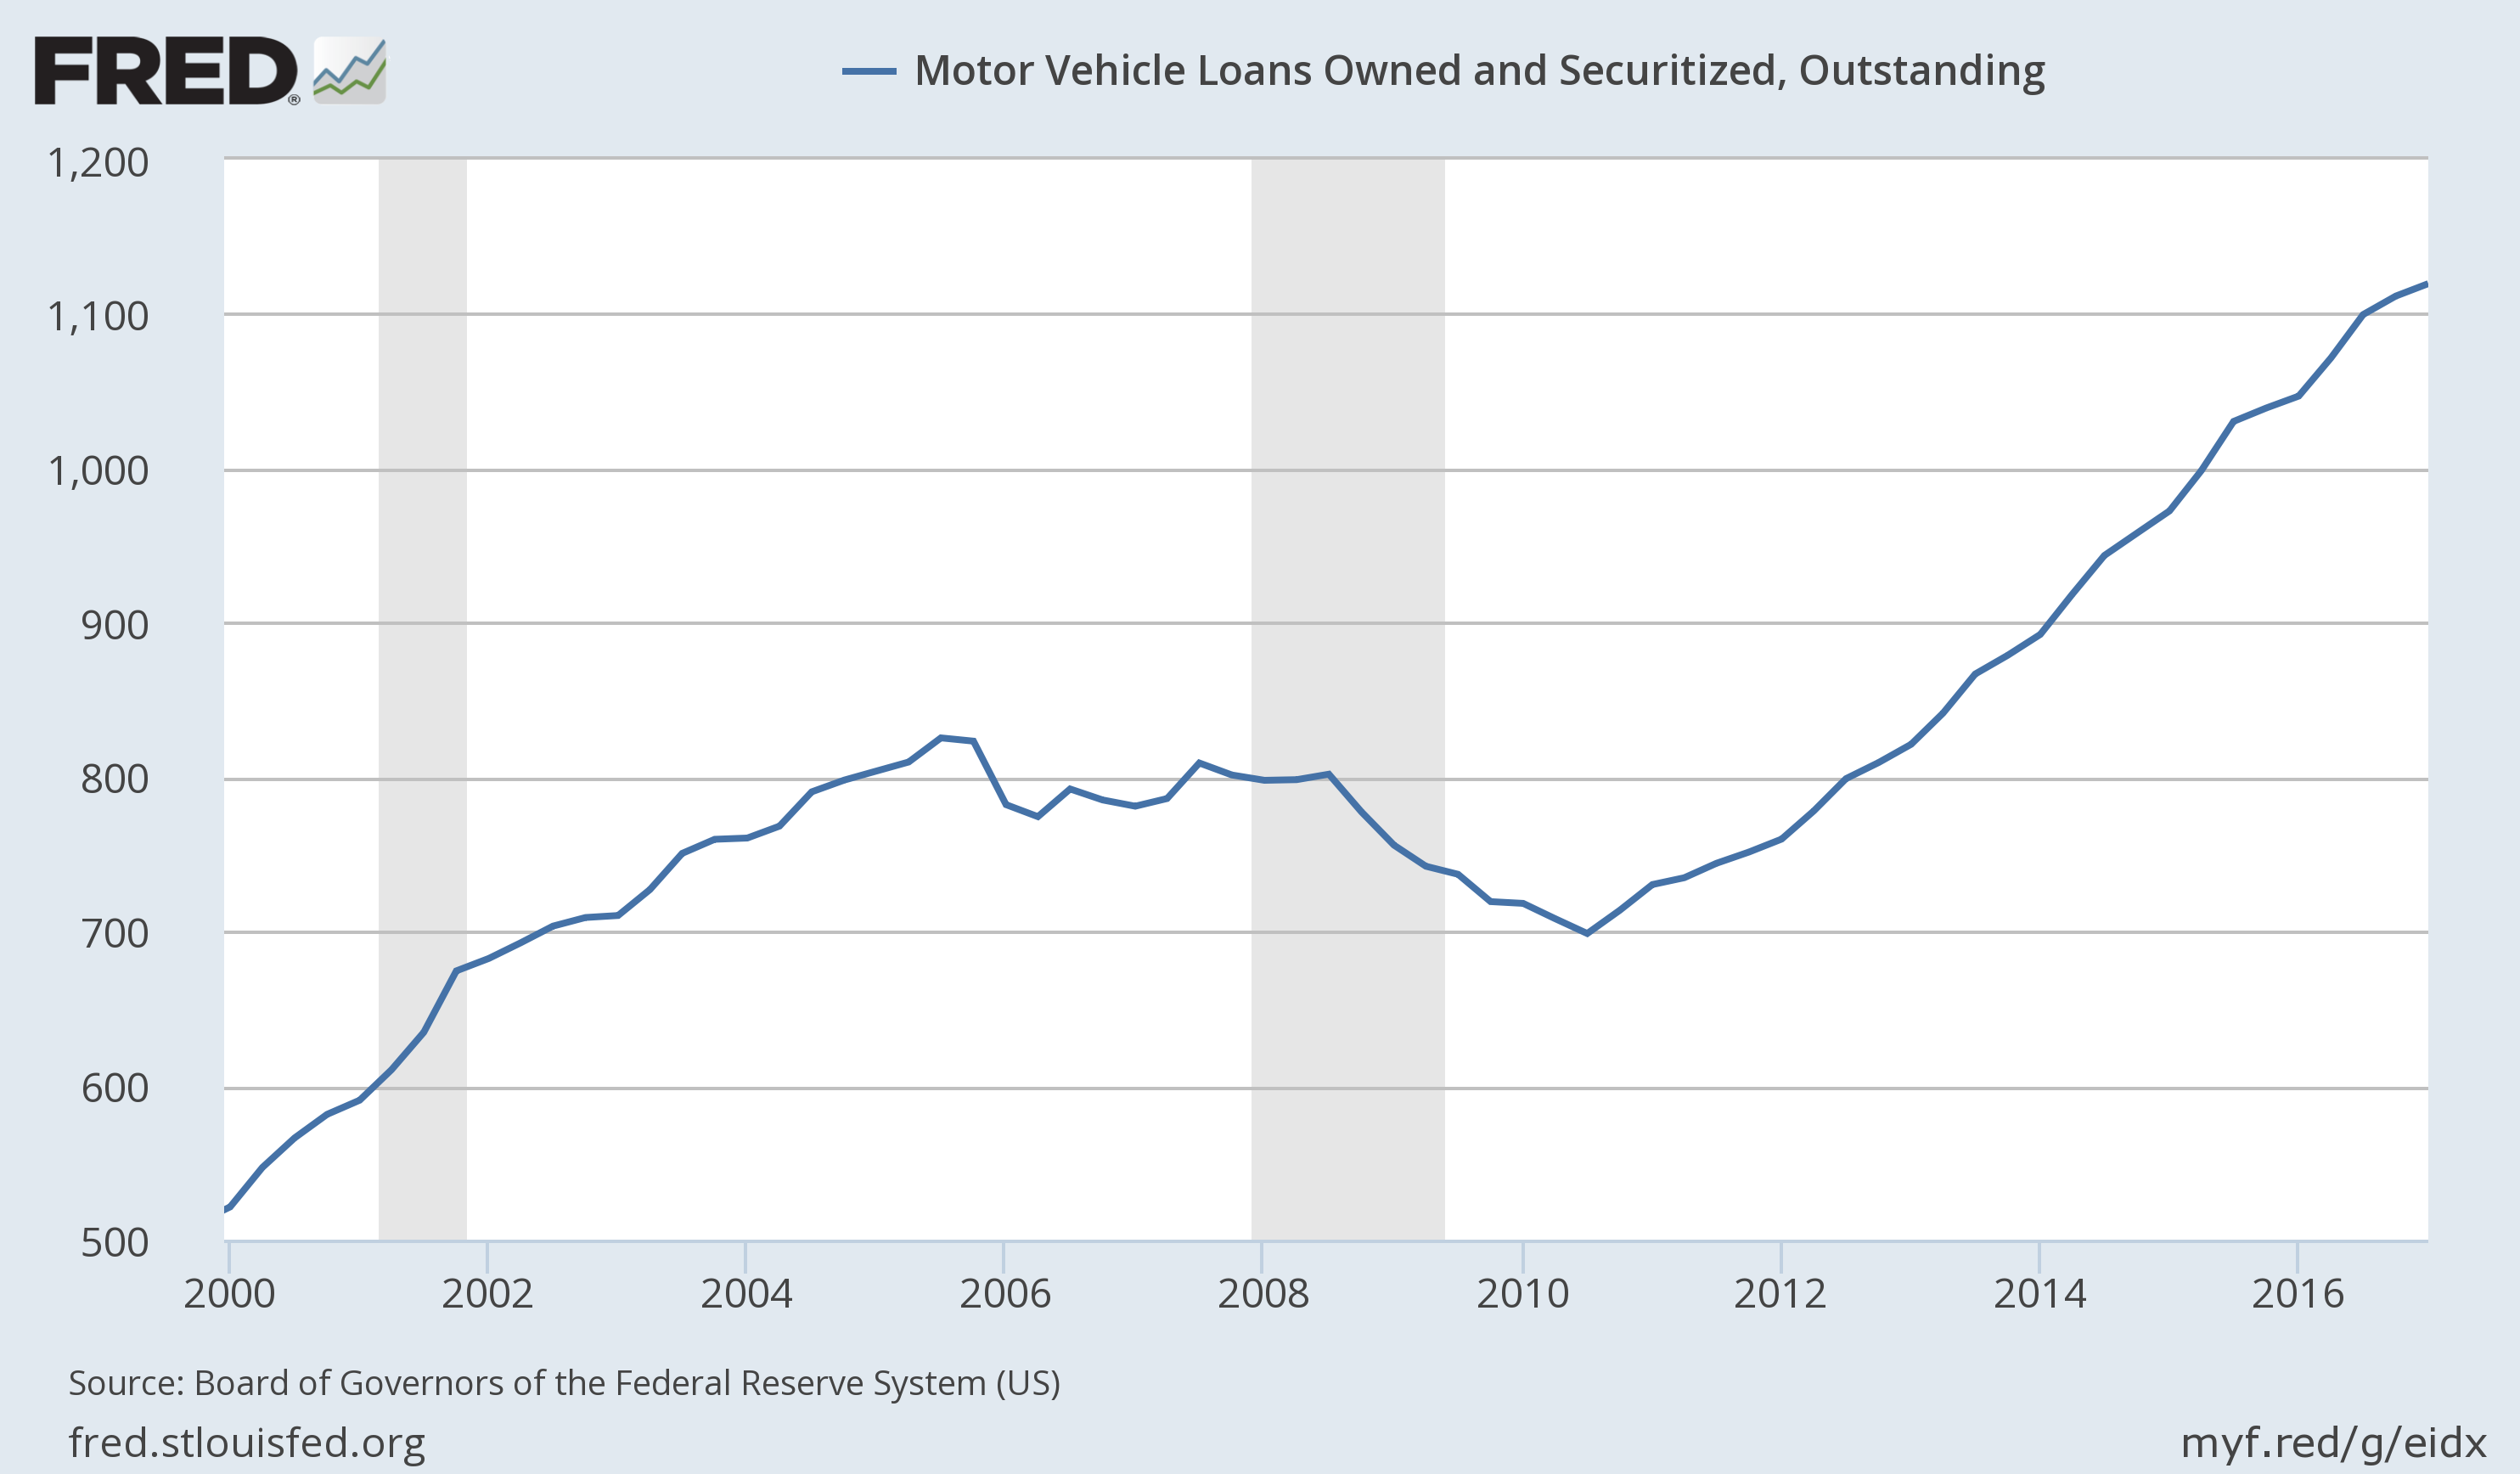
In addition, according to the St. Louis Federal Reserve, close to $400 billion has been added to securitized loans as a result of auto sales in the last five years. Unless this trend continues, it could put a dent in sales:

FRED Auto CDO

Philadelphia Fed Forecast: Slightly Stronger vs. Three Months Ago

According to the Philadelphia Fed’s Real-Time Data Research Center, the outlook for 2017 is slightly upbeat, particularly compared to a few months back:

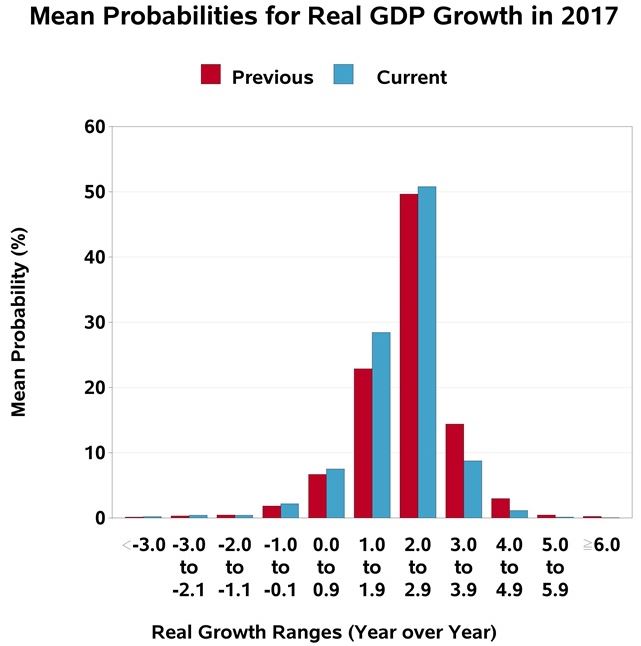
The U.S. economy over the next four quarters looks slightly stronger now than it did three months ago…forecasters predict real GDP will grow at an annual rate of 3.1 percent this quarter, up from the previous estimate of 2.3 percent. Quarterly growth over the following three quarters also looks improved. On an annual-average over annual-average basis, the forecasters predict real GDP will grow 2.1 percent in 2017, 2.5 percent in 2018, 2.1 percent in 2019, and 2.3 percent in 2020.

An improved outlook for the unemployment rate accompanies the outlook for growth. The forecasters predict that the unemployment rate will average 4.5 percent in the current quarter, before falling to 4.4 percent in the next two quarters, and 4.3 percent in the first two quarters of 2018. The projections for the next four quarters (and the next four years) are below those of the last survey, indicating a brighter outlook for unemployment.

The forecasters assign the following mean probability to GDP growth rates this year:

Mean Probability

Note on Inflation

One persistent element is the inflation outlook in the coming years.  The forecasters note a downward revision:

The forecasters expect current-quarter headline CPI inflation to average 1.6 percent, lower than the last survey’s estimate of 2.3 percent. Similarly, the forecasters predict current-quarter headline PCE inflation of 1.2 percent, also lower than the 2.0 percent predicted three months ago.

Measured on a fourth-quarter over fourth-quarter basis, headline CPI inflation is expected to average about 2.3 percent in each of the next three years, little changed from the last survey. The forecasters have revised downward their projections for headline PCE inflation in 2017 to 1.8 percent, but they pegged the rates for 2018 and 2019 at 2.0 percent, unchanged from the last survey.

Over the next 10 years, 2017 to 2026, the forecasters expect headline CPI inflation to average 2.30 percent at an annual rate, unchanged from the last survey. The corresponding estimate for 10-year annual-average headline PCE inflation is 2.09 percent, little changed from the 2.10 percent predicted in the previous survey.

While not completely unexpected, this inflation forecast demonstrates an interesting shift, especially given the state of full employment. See the full writeup with lots of stats here.

The Distinctive Skill Set of a Leader

What could you learn (or benefit) from a Harvard Business Review article from nearly twenty years ago? Quite a bit. Emotion Intelligence, according to its great champion Daniel Goleman is remarkable in terms of impact among effective leaders:

To create some of the competency models, psychologists asked senior managers at the companies to identify the capabilities that typified the organization’s most outstanding leaders…When I analyzed all this data, I found dramatic results. To be sure, intellect was a driver of outstanding performance. Cognitive skills such as big-picture thinking and long-term vision were particularly important. But when I calculated the ratio of technical skills, IQ, and emotional intelligence as ingredients of excellent performance, emotional intelligence proved to be twice as important as the others for jobs at all levels. (From Goleman, What Makes a Leader? in The Harvard Business Review, 1998).

EI is arguably the skill set above many, if not all others that distinguish a leader who is able to move things forward because she or he is good with others, being first and foremost, at ease with themselves, mature, experienced and in command of themselves. Goleman identified five distinctive elements that identify leaders who possess emotional intelligence in action, shown in the table below:

Goleman Emotional Intelligence Five Characteristics

See an overview below from the HBR blog and re-issue of the 1998 article, What Makes a Leader.


Fed: One Foot on the Brake, One on the Gas

Per the Wall Street Journal, Federal Reserve Chairwoman Janet Yellen sees enough strength in the economy to continue the process of normalizing interest rates over this year and the next, after finally topping a 2.1% inflation target in February. The Fed chair reports growth, but “at a modest pace.” As such, the policy calls for action seeking a middle ground:

Where before we had our foot pressed down on the gas pedal trying to give the economy all the oomph we possibly could, now [we’re] allowing the economy to kind of coast and remain on an even keel,” she said. “To give it some gas, but not so much that we’re pressing down hard on the accelerator.”

Another interesting note is what may happen to the Fed’s $4.5 trillion portfolio:

Fed officials raised rates in March for only the third time since the financial crisis, to a range between 0.75% and 1%. But they have penciled in two more rate increases this year, followed by three in 2018. They are also considering reducing the Fed’s $4.5 trillion portfolio of cash and securities, acquired during three rounds of asset purchases aimed at lowering long-term borrowing costs after the recession.

It also seems the inflation target is going hold at 2%, which may be much more realistic in the long term, per the chair, “Evidence suggests that the population roughly expects inflation in the vicinity of 2%.”

Brand Value! Los Pollos Hermanos and the New Season of Better Call Saul

Talk about brand value! For the upcoming (and very anticipated) Season 3 of Better Call Saul, AMC promotes with a very clever tie-in to a social icon from Breaking Bad: Los Pollos Hermanos. From Forbes, “Los Pollos Hermanos was an iconic location in Breaking Bad, with the Mexican themed chicken restaurant serving as the front for Fring’s meth empire.”

From the AMC site:

This imminent existential threat presses Jimmy’s faltering moral compass to the limit. Meanwhile, Mike searches for a mysterious adversary who seems to know almost everything about his business. As the season progresses, new characters are introduced and backstories are further illuminated with meaningful nods to the Breaking Bad universe.

Yes, the end won’t be better than the beginning but the journey is going to be excellent.

BCS

Volume at the Ports: Record Year at the Port of Los Angeles

It was a record year at the Port of Los Angeles:

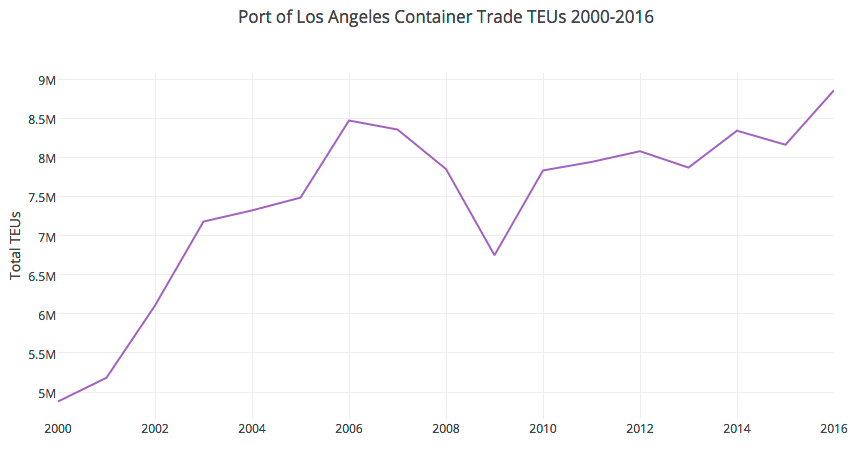
Cargo volumes at the Port of Los Angeles reached 8,856,782 Twenty-Foot Equivalent Units in 2016, marking the busiest year ever for a Western Hemisphere Port. The previous record was set in 2006, when the Port of Los Angeles handled 8,469,853 TEUs.

Attributed to the success is cited as understanding:

…”the importance of innovating and collaborating to move our economy forward,” said Mayor Eric Garcetti. “We have seen incredible progress over the last two years, and it speaks to the hard work and partnership between the City, business leaders, and the workers who keep our port running smoothly every day.”

The Port finished the year strong, with December volumes of 796,536 TEUs, a 27 percent increase compared to the same period last year. It was the Port’s busiest December and fourth quarter in its 110-year history. Overall in 2016, cargo increased 8.5 percent compared to 2015.

The end of the calendar year 2016 showed the following shipment activity:

Port of Los Angeles Container Trade TEUs 2000-2016

To put this milestone into perspective, look at the same time span filtered to total containers only (this illustrates the long crawl forward since the mid-2000s): Total Containers POLA

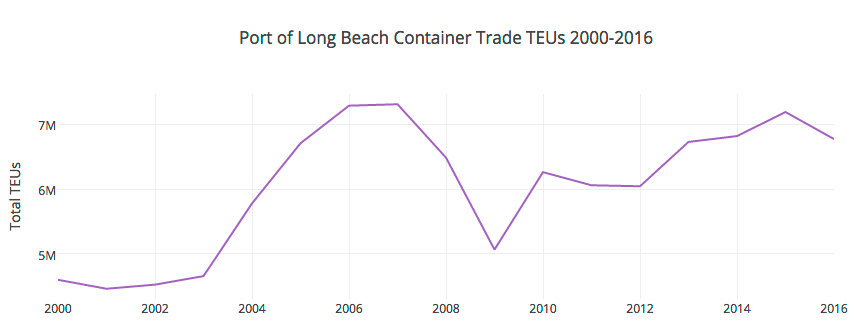
The Port of Long Beach had a little different year, but still posted strong results in spite of challenges:

Slowed by industry headwinds and challenges that included a major customer declaring bankruptcy, the Port of Long Beach still moved almost 6.8 million containers in 2016, its fifth best year ever.

Overall cargo declined 5.8 percent in 2016 compared to 2015, as the Port was impacted by new ocean carrier alliances and the August bankruptcy of Hanjin Shipping, a South Korean company and former majority stakeholder at the 381-acre Pier T container terminal — Long Beach’s largest.

By year’s end, the Harbor Commission had approved an agreement for a subsidiary of Mediterranean Shipping Co., one of the world’s largest container ship operators, to take sole control of the long-term lease at Pier T.

…“Last year was turbulent, with numerous ocean carrier mergers and other changes,” said Harbor Commission President Lori Ann Guzmán. “Now we have one of the largest ocean carriers in the world as a major partner and we’re well positioned to rebound in 2017. While the industry strives for equilibrium, Long Beach will continue be a reliable port of entry and continue to provide the fastest, most efficient services for trade from the Far East.”


Plot 378

Again, the change in volume since the mid-2000s is even more felt when viewing total containers only:

Total Containers POLB

20th Anniversary of One of the Most Iconic Expressions in Finance: Irrational Exuberance

Irrational exuberance has been one of the most iconic and recognizable phrases in the financial markets for the last twenty years – to the day. I remember this like it was yesterday, being a recent graduate and shortly after, working in the capital market. This really was the advent of an era where there has been no looking back: a tenuous and ambivalent relationship with the Fed and every nuance uttered by the Chair. Here is the full quote in its context:

Clearly, sustained low inflation implies less uncertainty about the future, and lower risk premiums imply higher prices of stocks and other earning assets. We can see that in the inverse relationship exhibited by price/earnings ratios and the rate of inflation in the past. But how do we know when irrational exuberance has unduly escalated asset values, which then become subject to unexpected and prolonged contractions as they have in Japan over the past decade? And how do we factor that assessment into monetary policy? We as central bankers need not be concerned if a collapsing financial asset bubble does not threaten to impair the real economy, its production, jobs, and price stability. Indeed, the sharp stock market break of 1987 had few negative consequences for the economy. But we should not underestimate or become complacent about the complexity of the interactions of asset markets and the economy. Thus, evaluating shifts in balance sheets generally, and in asset prices particularly, must be an integral part of the development of monetary policy.

Read the full speech from the minutes here.

Interestingly enough, here is some commentary in our present time declaring, “rationally exuberant,” (caveat emptor on long positions if you ask me):

Not everyone is convinced of this view to be sure:

In recent years the Fed has only doubled down on these policies by directly pursuing a “wealth effect.” Rather than give a boost to the broad economy, however, these central bankers have only accomplished an even greater and more pervasive financial asset perversion. Stocks, bonds and real estate have all become as overvalued as we have ever seen any one of them individually in this country. The end result of all of this money printing and interest rate manipulation is the worst economic expansion since the Great Depression and the greatest wealth inequality since that period, as well.

See the full post here.