Volume at the Ports and Twenty Years of Trends

While the ports of Long Beach and Los Angeles have trends that are somewhat at parity with one another, they certainly do not necessarily move in tandem. Which is probably the self-obviating point of different cargo. That said, I thought it would be interesting to plot the last twenty years of activity for the two ports. The Port of Los Angeles gets a little more granular with their posted statistics, but for the purpose of comparison, both data sets for the two interactive charts were set up consistently.

May showed the following shipment activity at the Port of Los Angeles:

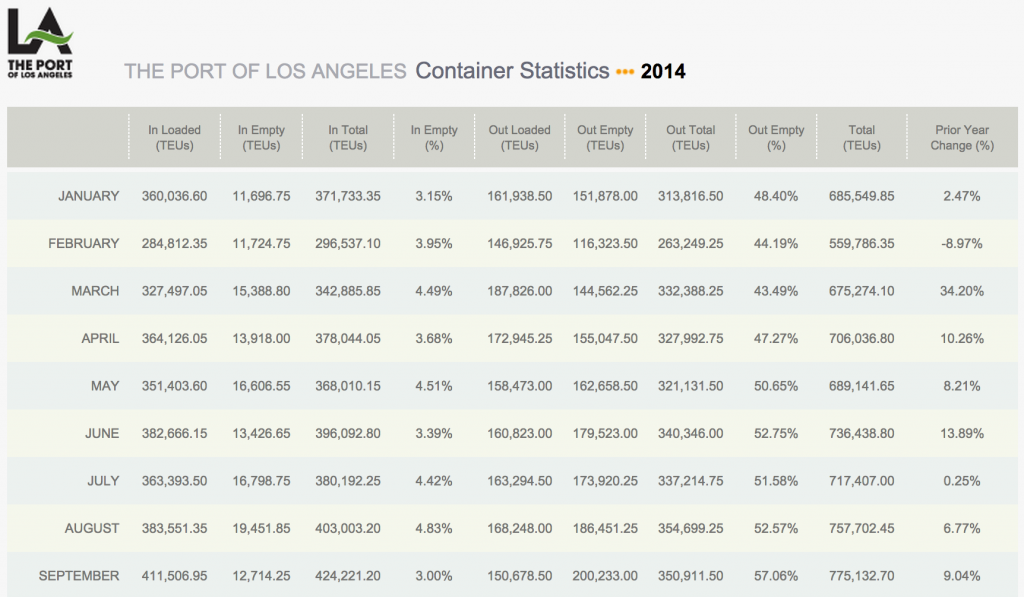
Containerized cargo volumes edged up .8 percent compared to the same period last year. The Port handled a total of 694,791 Twenty-Foot Equivalent Units (TEUs) in May 2015…Imports decreased .8 percent, from 351,403 Twenty-Foot Equivalent Units (TEUs) in May 2014 to 348,427 TEUs in May 2015. Exports declined 3.5 percent, from 158,473 TEUs in May 2014 to 152,917 TEUs in May 2015…Factoring in empties, which increased 7.9 percent, overall May 2015 volumes (694,791 TEUs) increased .8 percent. For the first five months of 2015, overall volumes (3,181,718 TEUs) are down 4 percent compared to the same period in 2014.

Mouse over the charts to see the underlying data, or select/de-select items from the legend:

Port of Los Angeles Container Trade TEUs

On the other hand, the port of Long Beach had the following swing in activity:

Cargo rose at the Port of Long Beach by 6 percent in May, the third consecutive month of growth, the busiest month since October 2007, and the busiest May since 2006. A total of 635,250 TEUs (twenty-foot equivalent units) of containerized cargo were moved through the Port in May. Imports numbered 327,317 TEUs, a 4.8 percent increase from the same month last year. Exports decreased 7.4 percent to 135,855 TEUs. Empty containers rose 22.6 percent to 172,078 TEUs. With imports exceeding exports, empty containers are sent overseas to be refilled with goods.

Port of Long Beach Container Trade TEUs

This is a welcome surge of activity as the fiscal year to date measurement of cargo is still lightly contracted from 2014. The Port of Long Beach attributes some of the volume to be due to a “stronger retail market,” as well as added activities and services “in order to boost cargo growth.”

The Marginally Attached – A Look at the Five Largest States

The U.S. Bureau of Labor Statistics (BLS) defines marginally attached in simple, straightforward language:

Marginally attached workers
Persons not in the labor force who want and are available for work, and who have looked for a job sometime in the prior 12 months (or since the end of their last job if they held one within the past 12 months), but were not counted as unemployed because they had not searched for work in the 4 weeks preceding the survey. Discouraged workers are a subset of the marginally attached.

Discouraged workers
Persons not in the labor force who want and are available for a job and who have looked for work sometime in the past 12 months (or since the end of their last job if they held one within the past 12 months), but who are not currently looking because they believe there are no jobs available or there are none for which they would qualify.

For the purpose of illustration, the FRED graph below has the top five states  selected (which accounts for more than a third of the nation’s population), showing the trend of marginally attached workers for more than a decade.

The trend lines show the inherent headwinds since the beginning of economic recovery in June 2009. The still “on the grid” numbers of the marginally attached and discouraged workers has hung on much longer than a decade ago. What’s more, six years into recovery, not one of these states has returned to its pre-recession level of the marginally attached:

Marginally Attached-Pre-Recession

This could be due in part to an aging population as well as population shifts and growth in general. This also illustrates why for so many, the recovery has not felt like a recovery. The reality is, jobs are being added as illustrated by the decreased levels of the marginally attached from the corresponding peak levels by state (peak levels were between July 2010 and October 2011):

Marginally Attached Percentage Below Peak Levels

Retail: The Front Page of our Economy

The National Retail Federation has provided an excellent (and large, 141 pages) study produced by PwC that shows the profound implications of retail on our overall economy. The report makes some bold claims, “according to the study, retail is the largest private employer in the United States. Retail directly and indirectly supports 42 million jobs, provides $1.6 trillion in labor income and contributes $2.6 trillion annually to U.S. GDP.”

Small Things Add Up

The report also has a lot to say about main street in America. With over 42 million jobs supported directly or indirectly the result of retail, and it may come as a surprise to learn that the majority of retail establishments making up the 29 million jobs are actually small businesses, “this report also makes clear that retail is American small business. An overwhelming majority of retail businesses – 99% –employ fewer than 50 people. In fact, these retailers provide 40 percent—or 11.5 million—of the 29 million jobs in retail.” See the industry comparison in the graph below (click for full size):

Direct Employment by Industry

Impact on the NAICS Cateogories – Top 5 by GDP

The interactive chart below shows the impact by category as tracked by the Census Bureau. The full table can be viewed here and is part of the report. Mouse over each data point to see the impact on the measurements of number of jobs, labor income, number of retail establishments and total GDP. Or select/de-select items from the legend:

Top 5 Retail NAICS Categories by GDP (2012)

Below is a well done 95 second overview of the highlights produced by the National Retail Foundation.


PBS American Experience: Silicon Valley – The History, Sociology, Timing and Sometimes Luck that Started a Revolution

If you think the history of the silicon chip is a cure for insomnia, think again. Two quotes (or as close as I can remember) say it all, the first, regarding breakthroughs. “Breakthroughs historically do not just happen. They are a product of when the time is right, and the time has come for such a thing.” So on the one hand, we can strive for excellence and push for a culture of creativity and this will certainly produce positive results. But especially in the case of a radical and essential breakthrough, one that we would look back on as disruptive to a system, technology, culture or business, the convergence of events is just as important as the components driving the change.

From the PBS Introduction:

Led by physicist Robert Noyce, Fairchild Semiconductor began as a start-up company whose radical innovations would help make the United States a leader in both space exploration and the personal computer revolution, changing the way the world works, plays, and communicates. Noyce’s invention of the microchip ultimately re-shaped the future, launching the world into the Information Age.

The next quote, regarding timing and demand as they relate to the brilliance behind groundbreaking change. “Brilliant people exist all the time. It’s matching up a brilliant person in the right place, at the right time when people want what that brilliant person has to offer.” We can push and push for change or a breakthrough idea, but ultimately, the timing of that change must correspond with demand in order to harness the brilliance that will fuel the progress.

What is causing the slump in productivity?

According to the World Bank in the World Development Indicators section of data, the organization’s aggregate measurement of the business lending rate is as follows,

The lending rate is the bank rate that usually meets the short-and medium-term financing needs of the private sector. This rate is normally differentiated according to creditworthiness of borrowers and objectives of financing. The terms and conditions attached to these rates differ by country, however, limiting their comparability.

The graph below is a look at lending in the United States in the last twenty years.

World Bank Lending Rate

The same trend is substanciated by the FRED data set, Weighted-Average Effective Loan Rate for All C&I Loans, All Commercial Banks:

So money is still remarkably cheap. But what about capital investment, and its effect on productivity? Unfortunately, productivity is at a mysteriously low level as shown by the following FRED data. Notice the flattening trend in the last several years, after what started as a normal looking upward trend at the beginning of the last (and current) recovery:

A number of recent articles have drawn attention to this. One, in the Wall Street Journal, The Mystery of Declining Productivity Growth concludes that while certain hypotheses are plausible or even tenable (such as declining capital investment), we really do not fully understand why the overall decline in productivity:

How dry and how lately? I prefer to date the slowdown in productivity growth from the end of 2010 because productivity growth (in the nonfarm business sector) averaged a bountiful 2.6% per annum from mid-1995 through the end of 2010, but only a paltry 0.4% since. Other scholars prefer earlier break points. For example, productivity growth averaged 2.9% from mid-1995 through the end of 2005, but only 1.3% since. Either way, the drop is large, and the scary thing is that we don’t understand why.

Many current assessments point to the lack of capital investment, opting for the repurchasing of stock in order to boost earnings per share. In some cases, even accessing some of that cheap money in order to repurchase common stock. In another recent article in the Wall Street Journal, Behind the Chronic Weakness of Capital Investment draws an even stronger correlation between productivity and capital investment:

In 2014, real gross domestic product was 8.7% above the level it reached just before the onset of the great recession in late 2007, according to the Bureau of Economic Analysis (BEA), yet gross private investment was just 3.9% higher. Private investment net of depreciation—an even better measure of keeping up production and innovation capacity—was $524 billion in 2013 (the last year for which we have good data), compared with $860 billion in 2006.

The impact of weak capital investment is partially revealed by the slowdown in productivity growth. Bureau of Labor Statistics data show that labor productivity grew at an average rate of just 1.5% a year between 2005 and 2014, and by 0.7% a year since 2011. These numbers compare poorly with the average annual growth rates of 3.3% between 1948 and 1973, and 3.2% between 1996 and 2004. Business formation and venture capital funding have also slowed in recent years.

The article cites a number of interesting possibilities, but again, hypotheses (including “uncertainty”) followed by no certainty for the exact reason for the decline in productivity, but the conclusion is grave, “given its importance to productivity, economic growth and rising living standards, it is well worth the efforts of political and economic leaders to find a path to constructive change.”

Washington Super Sizing Bank Boards Oversight

In yesterday’s Wall Street Journal, Regulators Intensify Scrutiny of Bank Boards outlined many of the problems inherent in bank boards, especially in the wake of the great crash of 2008 when the banking industry was exposed for just how risky and reckless a business it always has been, versus the illusion of prudence, conservatism and moderation. The result has been increased layers of oversight, now with final authority in Washington:

The Federal Reserve and other bank regulators are holding frequent, in some cases monthly, meetings with individual directors at the nation’s biggest banks, demanding detailed minutes and other documentation of board meetings and singling out boards in internal regulatory critiques of bank operations and oversight. In some instances, Fed supervisors meet more often with directors than the directors meet formally as a full board. Boards at small banks are also getting new attention from regulators.

But while the “2008 crisis showed regulators that some boards—and senior management—didn’t understand the risks firms were taking or didn’t exercise appropriate oversight,” additional problems may not be where you expect them:

In some cases, board members weren’t experienced enough or were too closely tied to the bank to perform their duties. Studies since the financial crisis—for example, the International Monetary Fund’s October 2014 Global Financial Stability report— have shown banks with independent directors are less likely to take on risk, while boards chaired by the bank’s CEOs take more risk.

As a result, the Office of the Comptroller of the Currency has turned its attention to bank boards and their activities as they specifically address risk, as well as their understanding of the activity their institutions are engaged in, resulting in “more supervisory contact with the boards than ever before.” According to the head of bank supervision at the Federal Reserve Bank of New York, “while the level of engagement varies across firms, in general, we are seeing boards being more active in asking questions, providing oversight of management and engaging with supervisors.”

Will it work? See two articles in the Financial Times from last year that may suggest otherwise: A reckless banking industry is a drag on the economy and Financial reforms will make the next crisis even messier.

Your Brain on That LED Screen

So many great things have come to us thanks to breakthrough innovation, technology and an avalanche of accompanying information. When evaluating the effects of all of this on culture, the biggest challenge does not seem to be determining the inherent good or bad of a shiny object or service delivered by it, but our management of it. It’s simply human nature, we are given to a lack of self control. Fortunately, an area of study that has continued in recent years in both breadth and depth, is neuroscience, and how our brains interact and interface with many aspects of life. It is no surprise then when we hear from both medicine and science that staring at shiny objects before bed actually has [potentially significant] negative implications on how well we function.

Reference: Business Insider – produced by Justin Gmoser.

A Discussion of Digital and Physical Retail Trends

Over at Barry Ritholtz blog I saw this video by Scott Galloway (at the Digital-Life-Design Conference) titled, The Four Horsemen – Amazon/Apple/Facebook & Google – Who Wins/Loses. Mr. Galloway is Professor of Marketing at NYU Stern School of Business where he teaches Brand Strategy and Digital Marketing NYU Stern School of Business, see his background here. In this presentation he packs a terribly insightful discussion into just fifteen minutes where he covers what he believes will be the advances and declines among the big four (“Four Horsemen”) of digital (and the convergence of retail) sales. Professor Galloway is quick to disclaim that any decline among these companies in no way means insignificant but rather, a shift in market share between four companies that hold a titanic share of the retail market.

A few high points from the discussion:

Amazon’s “race to the bottom” strategy where they then wait out the competition has an Achilles heel: shipping costs. The solution (or the future)? Fractional employment among the ranks of flexible employees such as Uber and Carpooling.com.

The trend of existing brick and mortar retail stores edging into the completion through the transformation of their retail locations into flexible warehouse fulfillment centers.

A few harsh words, matched off against some significant compliments for Facebook.

Key to Apple? It’s “self-expressive benefit.”

Finally, there was an unfortunate takeaway. The trend of Macy’s illustrates the further reduction of the middle class in America – “$40-60k jobs are giving way to $20-40k per year jobs” related to factory and fulfillment functions. So mid level service jobs are giving way to lower level service jobs, illustrating the point that even where there is job growth, no job is irreplaceable, which puts even more pressure on the individual to contribute value and if possible, make themselves indispensable.


Dated Policies and the Obsolescence of Command and Control

When you look around, what tips you off that policy may be out of date?

Dated Policy

The case has been made in recent years of the obsolescence of the average human resources department and its policies. But is the problem human resources or an overall approach? An article in Forbes by an industry expert makes the following assessment:

The traditional “Human Resources” programs which were designed in the early 1900s are rapidly falling away. Are they becoming out of date? The answer is yes.

If your HR and Learning programs are focused on building customer centric teams, empowering managers and people to make decisions, encouraging a culture of learning, teaching managers to coach and develop others – then you have moved to the Agile Model for HR. If your HR programs are still focused heavily on enforcing the rules, formalizing structure and centers of power, and putting leaders on a pedestal, then your HR and employee programs are probably holding your company back.

The lean, dynamic, open source and autonomous approach as cited above was what I read about more than twenty years ago in my undergraduate studies, but saw very little of outside of the tech industry, some small companies and a few unusual examples (organizational and leadership). But this problem is not limited to human resources – it permeates many aspects of business operations. I regularly equate this to doing business the way we did fifty years ago, only now with a computer on the desk. And command and control mentality goes right along with this failure not only to understand a radical and essential cultural shift, but how to tap into a talented labor pool. I’ve had several discussions with a colleague regarding why our industry does not generally attract millennials. I’m not sure there is one precise reason but clearly, value system, culture and command structure is completely at odds with this cohort.

In a recent post, HR Is Obsolete, a number of relevant reasons are cited for why, in the author’s opinion HR (in its lack of response) is obsolete. Here are some ideas from the findings:

The era that current policy reflects: when an HR department that was “created for the post-industrial revolution era as opposed to the information age.”…failure to implement technology that could automate operational tasks such as tracking compliance, licensure, etc…HR acting as surrogate instead of actually managing, mentoring and developing staff…dereliction of duty on the part of leadership regarding the hard work in hiring (no short cuts to getting the right person in the right role).

In a discussion about how to motivate staff, I had a boss declare in full volume, “my philosophy of leadership is simple, GET THE [EXPLETIVE] WORK DONE!” Here’s a helpful rule of thumb: if your attitude toward staff would fit well in an episode of Mad Men, your thinking is probably obsolete. Dated policies and approach are no different.

Smoking Safety - Australian Road Safety Council poster- 1950s

Another Volume Surge at the Port of Los Angeles

Significant volume burst of activity at the Port of Los Angeles with a rise in containers of 9% which is the “strongest month since August 2006,”

Total cargo for September was 775,133 Twenty-Foot Equivalent Units (TEUs). It’s the busiest single month at the Port since August 2006. The increased volume reflects peak season volumes and larger vessels calling at the Port of Los Angeles.

Container imports increased 11 percent, from 370,786 TEUs in September 2013 to 411,507 TEUs in September 2014. Exports rose 0.20 percent, from 150,380 TEUs in September 2013 to 150,679 TEUs in September 2014.

Combined, total loaded imports and exports increased 7.9 percent, from 521,166 TEUs in September 2013 to 562,185 TEUs in September 2014. Factoring in empties, which increased 12.2 percent year over year, overall September 2014 volumes (775,133 TEUs) rose 9 percent compared to September 2013 (710,892 TEUs).

For the first nine months of calendar year 2014, overall volumes (6,302,470 TEUs) have increased 7.8 percent compared to the same period in 2013 (5,847,167 TEUs).

Year to date at a glance is as follows (select the table for full size):

2014-10-16 POLA

This seems a little contra to this week’s census data,

The U.S. Census Bureau announced today that advance estimates of U.S. retail and food services sales for September, adjusted for seasonal variation and holiday and trading-day differences, but not for price changes, were $442.7 billion, a decrease of 0.3 percent (±0.5%)* from the previous month, but 4.3 percent (±0.9%) above September 2013.

And this from Logistics Management,

With the holiday shopping set to gear up in a few weeks, it looks like the retail sector could use a seasonal spark based on declining retail sales in September, according to data issued by the United States Department of Commerce and the National Retail Federation (NRF).

Commerce reported that September retail sales at $442.7 billion were down 0.3 percent compared to August and up 4.3 percent compared to September 2013, and total retail sales from July through September are up 4.5 percent annually.

The NRF said that September retail sales, which exclude automobiles, gas stations, and restaurants, dipped 0.1 percent seasonally-adjusted month-to-month and increased 4.6 percent annually on an unadjusted basis.

“Retail sales were surprisingly weak in September,” NRF Chief Economist Jack Kleinhenz said in a blog posting. “Despite increasing consumer confidence, an uptick in employment, lower gas prices, and with inflation in check, consumers still slowed spending. Reconciling consumer confidence with consumer spending continues to be a challenge.”

But it may very well be a different set of expectations in terms of retailer sentiment as they gear up for the holiday season.

How Vision, Mission, Values Relate to Strategy

Just as we act on what is important to us, the same is true for an organization (considered as a whole). This is why there is so much discussion of vision, mission and values: they act as drivers behind all that is strategic within the organization. I remember a good point from one of my graduate texts where the prescriptive advice was for mission and vision to contain simplicity and intentional ambiguity. The authors suggested that the organization’s vision  should be “a simple statement of where a firm is going, and what the firm’s leaders want it to be in the future. A statement of vision is forward-looking and identifies the firm’s desired long-term status.” Ambiguity has the benefit of enabling flexibility where “changing strategy or implementation tactics when it looks as if business as usual isn’t going to realize the expressed vision.” This forms a framework of business strategy that is not to be confused with a granular to-do list, but offers guidelines to be selected and applied to a particular organization (as it exists at that moment in time), and its particular strategic plan that is driving the mission, vision and values to completion.

From here, the leadership team must lead with organizational effectiveness.  As outlined in Michael Porter’s What is Strategy, written decades ago in the Harvard Business Review, there must be organizational efficiency and effectiveness for a firm to realize its strategic goals, wherever those goals will lead. This is where the giftedness of a chief executive to attract and lead a team that will take the organization to strategic success, utilizing the particular expertise represented by each of the components of the leadership team. In order to be successful, this same leader will actually look for people who possess greater strengths than his or her own (in a given area) for the cumulative benefits and success of the organization as a whole. This team will work in the context of strategic coherence. The simple but significant takeaway is that the components of a strategic framework function together, in a harmonious fashion that continuously moves the ball down field toward goals that are expressed with clarity or what has been described as, “a burning imperative.”