An Aging Nation: U.S. Census Interactive Graphic

Last year, the U.S. Census issued an excellent report, An Aging Nation: The Older Population in
the United States – Population Estimates and Projections and as you might guess, the findings are nothing short of alarming. Why? Because the findings in the report have a number of significant implications connected with aging in general and all its added responsibilities such as health care and social security. What’s more, the very large baby boom cohort (the report uses the traditional timespan of those born from 1946-1964) has for some time represented such a significant part of the work force, but now its rotation out of the workforce is adding to the weight of what the report labels, “older population” (defined as those above 65 years of age). Combine this with the extrapolation of the older Generation X cohort in the next few decades, plus overall mortality projections showing increased life expectancies and you have a mind boggling number of people not only meeting the definition of older, but in excess of 85 years of age.

Historical Look Using an Interactive Graphic

Below is an interactive graphic from the Census Bureau that can be used in two ways. Slide the year along the bottom for a view of the population breakdown by age at a given point in time in the last ten to fifteen years. Going back fifteen years to the year 2000, you see a very large cohort in their thirties to early fifties. As you slide the year to the right (toward the present), you see the rising age, which is somewhat self-obviating given the starting point. But then as you reach the near present, you see a surprising trend of a new cohort, now in their early twenties to early thirties, representing a significant part of the population.

Implications of the Elderly

According to the projections in the Census report:

Between 2012 and 2050, the U.S. population is projected to grow from 314 million in 2012 to 400 million in 2050, an increase of 27 percent…By 2030, more than 20 percent of U.S. residents are projected to be aged 65 and over, compared with 13 percent in 2010 and 9.8 percent in 1970.

The report identifies mortality rates as the driver of trends:

The size and composition of the older population in 2050 will be largely determined by two factors: the size and composition of the population 27 years and over in 2012 and the future course of mortality for that population. While past fertility rates were the main driver shaping the size of these cohorts to date, mortality will influence the pace at which that population declines at the older ages.

…The mortality assumptions for these population projections are guided by past trends and current levels of mortality observed in the United States and in other developed nations. Trends in health-related conditions such as smoking and obesity were also assessed.

Survivorship rates have shown improvement for many decades. In the United States, life expectancy at age 65 was 15.2 years in 1972 and rose to 19.1 years in 2010—a net gain of 3.9 years. The survival gains for those turning 85 have also been impressive. In 1972, the average time to live for someone turning 85 was 5.5 years. By 2010, this had risen to 6.5 years—a net gain of 1 year. Similar trends have been observed in almost all developed nations. For example, life expectancy at age 65 in Sweden increased from 15.7 years in 1972 to 19.8 years in 2010. Life expectancy at age 85 in Sweden increased from 4.9 years in 1972 to 6.2 years in 2010.8

There is a little bit of irony in these trends. On the one hand, you have things like the reduction of smoking that is practically guaranteed to reduce health risks and increase life span in most people. But on the other:

The incidence of obesity increased dramatically between 1980 and 2008, doubling for adults and tripling for children (National Center for Chronic Disease Prevention and Health Promotion, 2011)…The direct effect of obesity on survival is less than that for smoking, and there is evidence that the trend is leveling off. The longer-term implications are yet unknown, but could dampen continued improvements in survivorship in future years.

These trends may simply point to the advancements of medicine and technology, but as the above quote points out, the long-term implications of this fairly recent trend are yet unknown. Where is this all leading? As mentioned previously, there are significant implications for Social Security and Medicare, but these are only two examples (although the largest by far) as there are many pension and health care systems throughout the different states and regions of the U.S. There is also the continuous discussion of potential growth in the overall economy. The idea that traditional growth of 4% is not currently realistic (or possible) given the number of workers from the boomer cohort reducing labor participation rates and thus reducing spending, is a common assumption. On the other hand, the very large cohort representing a younger population as well as those in their prime working ages cannot be ignored. While it’s true that availability of workers does not produce jobs, if a number of fundamentals change in the next few years, there could be expansion that we have not seen in years. How might this match off against the implications of an aging population? One thing is certain, in the traditional sense of employment, we have not yet figured out (cumulatively) how to best utilize this large, younger cohort. And we have still not yet adjusted to a post industrial era.

Public Libraries Disrupting the Likes of Amazon

When you think of the modern iteration of your local public library, a couple things might spring to mind, such as the perverts sitting at the computers offending everyone around them in the name of free speech. But another might be the question, how long can this model of an institution last? Well chalk one up for another blow to the hard and fast rule of disruption. I have observed the growing catalogue in recent years of digital material available for check out, including audio as well as e-books. But in the age of streaming versus download, the for-profit sector has started rolling out its own version of subscription based reading, and they face headwinds of an unlikely competitor, as noted in the Wall Street Journal, Why the Public Library Beats Amazon—for Now:

A growing stack of companies would like you to pay a monthly fee to read e-books, just like you subscribe to Netflix to binge on movies and TV shows. Don’t bother. Go sign up for a public library card instead. Really, the public library? Amazon.com recently launched Kindle Unlimited, a $10-per-month service offering loans of 600,000 e-books. Startups called Oyster and Scribd offer something similar. It isn’t very often that a musty old institution can hold its own against tech disrupters. But it turns out librarians haven’t just been sitting around shushing people while the Internet drove them into irrelevance. More than 90% of American public libraries have amassed e-book collections you can read on your iPad, and often even on a Kindle. You don’t have to walk into a branch or risk an overdue fine. And they’re totally free. Though you still have to deal with due dates, hold lists and occasionally clumsy software, libraries, at least for now, have one killer feature that the others don’t: e-books you actually want to read.

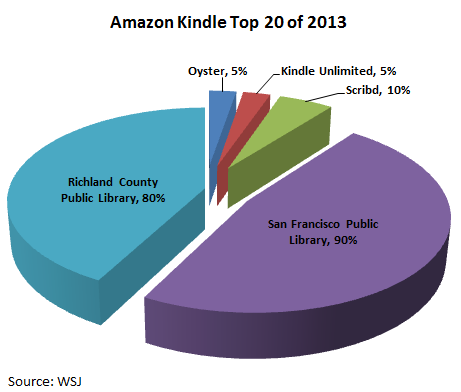
E-books you want to read? That’s right. So instead of an all-you-can-read list of digital titles with the equivalent of Smokey and the Bandit III, you have access to many of the titles from Amazon’s top 20 Kindle best-sellers of 2013 list with the following impressive results:

Percentage of Top 20 Kindle Titles of 2013

See the full grid from the WSJ article here. The article goes on to explain an interesting history of this windfall for local libraries:

How did library e-book collections get such a leg up? Amazon is locked in a hate-hate relationship with many publishers, so none of the five largest will sell their whole collection to Amazon for its subscription service…Over at the library, the situation is different. All of the big five publishers sell their e-book collections for loans, usually on the same day they’re available for consumers to purchase. They haven’t always been so friendly with libraries, and still charge them a lot for e-books. Some library e-books are only allowed a set number of loans before “expiring.”

There are obvious limitations to free services, such as availability, wait lists and time span for checked out materials. But for now, this is a terrific example of a public institution in the local community showing itself able to respond to disruptive forces, and provide viable resources to a wider audience with limited resources. It is also an excellent example of how a business model can benefit from adapting to a model that helps a local community as “publishers have come to see libraries not only as a source of income, but also as a marketing vehicle…since the Internet has killed off so many bookstores, libraries have become de facto showrooms for discovering books.” See brief overview here:

A Rough Assessment of Greenspan’s Career

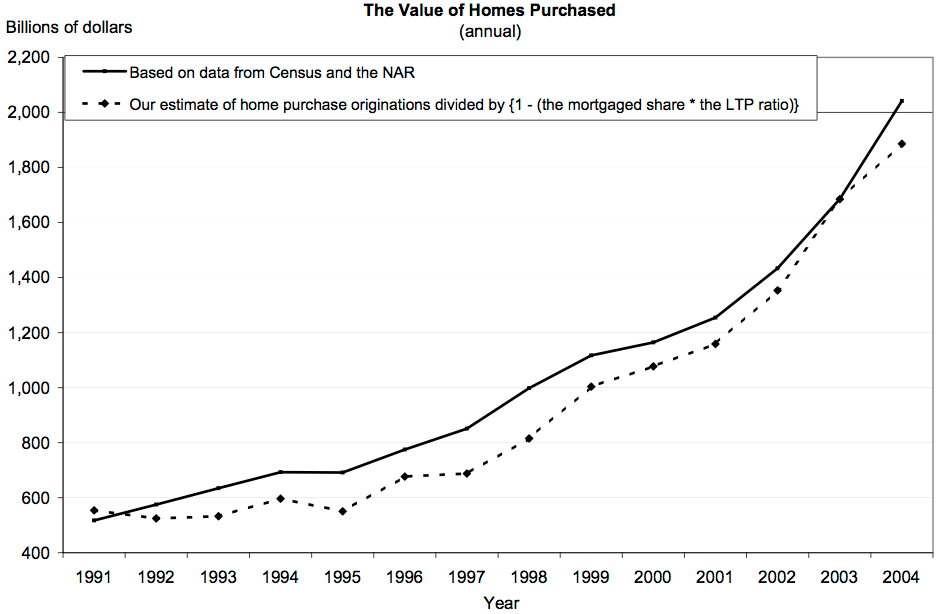
Barry Ritholtz has written an assessment of Greenspan’s career which spanned multiple decades and used it as somewhat of a chopping block pointing out both inconsistencies, enigmas and outright head scratcher anecdotes from his career. I will never forget reading Greenspan and Kennedy’s paper, Estimates of Home Mortgage Originations, Repayments, and Debt On One-to-Four-Family Residences (written a good deal before the crash) where the authors discuss regular mortgage debt outstanding (RMDO) from the Federal Reserve Board’s flow of funds accounts where couple of things really stand out, of course, now through the filter of hindsight. Specifically, how “extractions” of home equity were to be paid back. The methods outlined were, “those resulting from refinancings, cancellation of debt by home sellers (separated into foreclosure sales and all other sales), unscheduled mortgage repayments, and scheduled amortization.” The first two mentioned should have been a warning of alarmist portions, namely, the idea that extractions were simply going to be paid back by papering over them with more debt, and certainly this happen for a while. But also, the assumption that there was always going to be someone who came along behind you and got into more debt than you did. The data from this paper spans through 2004, two years after the following activity pointed out by Ritholtz in, Celebrating Greenspan’s Legacy of Failure:

Amid the 2001 recession, and immediately following the Sept. 11 attacks, the FOMC brought rates down to new lows. Rates were under two percent for three years, and at one percent for a full year. This was simply unprecedented, and the impact was severe. Everything priced in dollars ramped higher. Inflation expanded rapidly, Gold began a decade-long bull market, and oil increased from about $20 to almost $150. The housing market took off, and rose faster and higher than ever before, setting up the inevitable denouement.

The result was clearly illustrated in the tables of Greenspan’s working paper from 2005, asset inflation:

Home Values 1991-2004

But this was not seen as a cause for alarm, as reflected in the Chairman’s words from a year earlier,

In evaluating household debt burdens, one must remember that debt-to-income ratios have been rising for at least a half century. With household assets rising as well, the ratio of net worth to income is currently somewhat higher than its long-run average. So long as financial intermediation continues to expand, both household debt and assets are likely to rise faster than income. Without an examination of what is happening to both assets and liabilities, it is difficult to ascertain the true burden of debt service. Overall, the household sector seems to be in good shape, and much of the apparent increase in the household sector’s debt ratios over the past decade reflects factors that do not suggest increasing household financial stress. And, in fact, during the past two years, debt service ratios have been stable.

As pointed out by Ritholtz, in the end, “Greenspan ultimately conceded there was a “flaw” in his market ideology. Easy Al, as traders had taken to calling him, recognized that allowing radical deregulation of credit markets was a mistake, as was opposing rules on derivatives and ignoring the subprime and non-bank lenders at the heart of the financial crisis.” In light of this, it’s no wonder at all that there is continued discussion of the complexities caused by headwinds five years after the official end of economic recession.

Leadership and Developing Cooperative Participants

Team building is about leadership and discernment. Different strengths are needed at different times in a given context. This is why fit, among other qualifications is so important. But within any type of organization, there is the need for leadership who does not simply lead or direct, but develops cooperative participants. It is well established (and pretty much common sense) that a leader is going to build a team by outlining and inspiring vision, direction, and a cumulative goal. But what tools are effective for constructing and leading such a team, and what are the positive outcomes?  Many a strong personality can cajole people into action, with dictatorial command from behind, or at the other extreme, running roughshod over people so far in front that team members are discouraged from participating. This of course is not team building at all. And the real loss is missing out on all the distinctive strengths and perspectives that each member of a creative and critical thinking team can produce together.

One author has suggested three skills to correct this error where the contributions of team members are not being taken advantage of: inviting genuine critical assessment and input without fear of retribution, receiving input while suspending judgment of it, and acting in a responsive manner to questions. Pretty simple, but requiring a great deal of confidence to implement. Leaders who do this though, will draw out ideas and creativity that people may not realize they had and find that motivation becomes less of an issue to try and generate and more of one to steer in the right direction.

How Optimism Bias Changes Long-Term Projections

Weekend reading: IMF Working Paper, Growth: Now and Forever? by Giang Ho and Paolo Mauro. Those who do not follow the global market in general and the BRICs in particular (or other emerging economies), may not see a correlation to the U.S. market. In reviewing the paper, I would focus more on the psychological behavior of investors and the capital markets, rather than the particulars of emerging markets, their fundamentals, or the drivers in these markets, many of which are quite different from any of the G7. The premise is clearly stated in the abstract,

Forecasters often predict continued rapid economic growth into the medium and long term for countries that have recently experienced strong growth. Using long-term forecasts of economic growth from the IMF/World Bank staff Debt Sustainability Analyses for a panel of countries, we show that the baseline forecasts are more optimistic than warranted by past international growth experience. Further, by comparing the IMF’s World Economic Outlook forecasts with actual growth outcomes, we show that optimism bias is greater the longer the forecast horizon.

Just what do the authors mean by optimism bias? It’s frankly, little more than wish fulfillment. In the authors’ opinions, it is adding more weight to recent occurrences, then extrapolating those positive outcomes across the spectrum of events, where “forecasters often predict continued rapid economic growth into the medium and long term for countries that have recently experienced strong growth.” Again, this does not have a direct correlation to recent events in the U.S., as this economy has experienced forward yet modest growth in the last five years. But could this say anything about the continued expansion in the capital markets, which have little relation to economic events as they tend to affect the average person, employment and a service driven economy? In other words, although the markets seem to be pushing forward at dizzying heights, most would say there is nothing to indicate any kind of an eminent correction. Is the same bias at work in our capital markets? You decide. But the paper makes for an interesting case for why, in spite of argumentation for why global growth may in fact be slow in the coming years, forecasters continue to project strong growth, where predicting “economic growth into the medium term and beyond is notoriously difficult.” It would seem there are lessons to be learned here about bias from any perspective and how this bias has a tendency to affect the view of the future.

Ignorance is NOT Bliss

“The only real mistake is the one from which we learn nothing” – John Powell

Right now the overall job market is an undeniable difficulty for us as a country. Thinking about this reminds me of a few things from some years back. The above quote causes me to reflect on a few difficult times and painful past lessons – experiences which are now filtered with hindsight (and the advantage of 20/20 vision as it were). But I am thankful for the experience of many of these difficulties, though some have taken years to get to that point. After one painful business experience in particular, I was encouraged by a friend (at a different stage in life and much more experienced than I) to journal out what I had learned. I remember that at that time, I didn’t want to hear of it, and I certainly didn’t want to talk about it, even alone within the very safe pages of a journal. All I could think about was the frustration I was experiencing from my own decisions, some of them hasty. But learning is an ongoing, dynamic process.

Sometimes, I believe, we don’t feel quite ready to learn from what we are presently going through. Which is part of the reason I am determined to learn from decades past, because our current problems span way beyond few years of misguided choices. I am optimistic too, because I think for many, there is an honest inquiry into present difficulties, and why past approaches may no longer be relevant. Ultimately, I want to be a better learner, and a better practitioner of that knowledge and experience.

The Lesson of ‘Good Enough’

Comparing and contrasting the birds-eye view with the worms-eye view

The higher a person ascends the ranks of financial operations, the more imperative it becomes to discern between certain levels of detail, and the need to push work products forward to completion. This is especially true in the budgeting aspects of financial operations versus compliance issues in accounting and auditing which can become exceedingly nitpick at times. Closely related to this is the need to learn to communicate financial information to other business professionals who are not financial specialists. This can proved to be exceedingly difficult for a highly competent analyst who frankly, loves “getting their hands dirty.” In other words, this is not meant in any way to trivialize the value of a highly detail oriented analyst. But it is meant to serve as a cautionary note to those who wish to exercise leadership that is built upon their years of financial expertise. Two quick thoughts may serve to illustrate this: the worm’s eye view and the bird’s eye view, each with its strengths and limitations.

The worm’s eye view will assist with a great deal of detail, but sometimes distorts reality due to its limitations of vision. This is not to in any way demean or devalue the benefits or the work of highly detail oriented people. It is simply to say, sometimes in order to complete certain types of work in a timely manner, decisions of priority must take precedence over the desire to continue with hedgehog-like determination and the quest for perfection that is sometimes not practical.

The bird’s eye view on the other hand, enables a panoramic vision of the whole while simply limiting detail. Both have their function in analytical work. But here is the takeaway. Leaders communicating financial information need to be able to deliver highly summarized, accurate information. Then in an instant, zoom into detail in response to a question, request for clarification, etc. Then zoom back out to high level – smoothly and reassuringly. Listen to a few quarterly earnings conference calls for effective and ineffective examples. For the executive leader, a careful distinction between the two approaches and the timing of the each is essential.

IBM’s Mysterious “Big Blue” Nickname

In honor of IBM’s conference call, I wanted to revisit the topic of the provenance of the nickname, Big Blue.

IBM's Mysterious Ubiquitous Name - Big Blue. Logo "bluing" courtesy http://howbehindwow.com/

IBM’s Mysterious Ubiquitous Name – Big Blue. Logo “bluing” courtesy http://howbehindwow.com/

I like urban legends not because they are believable, but because of what they say about human nature and sociology. Urban legends are also amusing not necessarily to believe, but they are fun to engage in (as if to believe) the idea of them being true, such as us humans ingesting eight spiders per year in our sleep.

A search for the provenance of the name Big Blue turns up very little historical documentation. Some say the term was first used in the early 1980’s, with the self-obviating point of the adjective big. But that doesn’t explain much. There are plenty of organizations with significant size, extent, influence, market share or intensity, and we don’t automatically add big to their description. The blue part seems to have no plausible theories at all. I have tried in vain to find the origins of this name, as I found myself instinctively using it years ago before ever realizing it was an ubiquitous nickname. I searched Google Books for the term and have been able to move the date back to 1975 with this mention. But the truth is, no one really knows the origin, including IBM:

How did IBM get its distinctive nickname, “Big Blue?” While the name came about organically, with no known single source, the first official reference in print to IBM as “Big Blue” was in BusinessWeek magazine:

“No company in the computer business inspires the loyalty that IBM does, and the company has accomplished this with its almost legendary customer service and support … As a result, it is not uncommon for customers to refuse to buy equipment not made by IBM, even though it is often cheaper. ‘I don’t want to be saying I should have stuck with the “Big Blue,”’ says one IBM loyalist. ‘The nickname comes from the pervasiveness of IBM’s blue computers’” (No. 1’s Awesome Strategy, BusinessWeek, June 8, 1981).

So there you have it. Isn’t that great, kind of mysterious and interesting? Or at least, it’s fun to engage in any of the possible explanations.

Shared Credit for Hard Work

The way to get things done, is not to mind who gets the credit for doing them – Benjamin Jowett

Credit for hard work is not something we should seek to avoid. But at the same time, should we not be overly preoccupied with acknowledgement if our goal is truly to produce our very best work product [as possible] with what is required of us right now.  Self-aggrandizement, overbearing personalities, and the inability to actively and empathetically listen, short circuit the team building process and the natural outworking of progress.

This disproportionate concern with acknowledgment runs contra to the concept of a team, and its accomplishments.  Goals and objectives can still be accomplished by an organization with leadership who tends to be in it for themselves, but who wants to live “one man’s dream” when you could experience all the benefits of healthy team effort? It goes without saying that at best, it is generally not pleasant for those who have to constantly to one person’s ideas to the exclusion of all others. But at worst, over the long haul, an organization will have to deal with the wreckage of only one person being heard. When contributors are heard, included and acknowledged, I think it will encourage not only being truly on board with an organization and its mission, but these same people can become the greatest advocates for changes needed in response to challenges.

Center of the U.S. Population 1790-2010

The U.S. Census Bureau has some of the most interesting data visualizations, many of which help illustrate the magnitude of the data being presented. According to the Bureau, after each decennial census is tabulated, “the Census Bureau calculates the center of population. The National Mean Center of Population based on the 2010 Census is near Plato, Mo., an incorporated village in Texas County.” The mean center is fictitious of course, for the purpose of illustration as the Bureau goes on to explain, “the center is determined as the place where an imaginary, flat, weightless and rigid map of the United States would balance perfectly if all residents were of identical weight.” And the movement is in a southwesterly direction as the interactive map below illustrates: 

What is even more interesting are the suggestions for why the migration has moved in this direction. The Bureau states that the westerly direction has historically been the result of a “sweep [that] reflects the settling of the frontier, waves of immigration and the migration west and south.” But it is fair to say that although the imaginary mean center still resides in the South, a very large and disproportionate part of the population (as well as commerce) has settled in the West in general and California in particular. And there is a clear movement (though not a net loss) from California and the Southwest. The economic and sociological reasons for this would be very interesting to explore.

Procrastination: An Overwhelming Sense of Dread

Sometimes when I procrastinate, I find it is out of a sheer overwhelming sense of dread.  This dread is knowing what needs to be done, and for whatever reason, perhaps outside pressure, truncated schedule, the mental or physical output of energy needed, or maybe all contribute to coming up with any and every rationale for not concentrating on the most important thing to be doing right now. An article that appeared in the Journal of Psychology from a decade ago asserts that this “self-regulatory avoidance reaction” or our inability to exercise the willpower or self-control needed to concentrate or direct our energies to the right task, is “core central to procrastination.” It is suggested that part of the resolution to procrastination is associated with understanding the behavior and then avoiding it. In other words, admit it with the intention of quitting it.  

In my early college years, the need for self-control in time management was self-obviating, and I regularly admitted it.  And the discovery of the to do list was nothing short of revelatory.  This was first suggested to me by a professor my very first finals week when I was feeling a bit overwhelmed.  The reasoning was, “get all these items you are thinking about ‘out of your head’ so you can concentrate on the most important task right now, then, move on to the next one and so on.”  The very practical (and in some ways original work in modern time management), How to Get Control of Your Time and Your Life, outlines various tests and exercises for coming up with goals, objectives, and prioritization, and listing them out in different groupings, with each group having a special purpose, a similar method. Followed by the addition of monitoring safeguards similar to those set forth in the Journal of Psychology. 

For everyone within the organization from the admin to executive leadership and everyone in between, these principals are important. But for the executive leader, self-control in one’s use of time has tremendous implications. And this is our leverage: prioritization, improvement and innovation for the purpose of actually working smarter, rather than longer and longer. It’s one or the other. I have observed many over the years who put in excessive hours and sadly, this does not automatically translate into a great team builder, great leader, or someone who really takes advantage of the of the resources available to them, just someone who seems to be defined by long hours. I have also worked in these environments and have put in excessive hours myself because the whole culture and system required it, and I really do not think it has benefited me at all, besides reinforcing my work ethic. Learning to leverage available resources (the most significant by far being people) is critical to success. Time has it’s limitations – 168 hours per week – leverage is potentially limitless. As Alan Lakein encouraged his readers forty or so years ago to answer, “what is the most important thing to be doing right now?” Stop procrastinating and do it now.

Population Shifts After Ten Years: 2002-2003 and 2012-2013

According to the U.S. Census, population shift has occurred for the following reasons:

Spurred in part by growth of the energy sector, some metropolitan and micropolitan statistical areas in North Dakota and west Texas are now experiencing rapid population gains, while growth has slowed or halted for some formerly fast-growing areas in the South and West.

What you immediately notice are the dark green shaded areas (representing 3+ percent growth), many of which that were, of course, where the height of the madness was occurring during the real estate boom. Some of these areas were the southwest states and especially California (generally anywhere east of the San Andreas Fault). As well as selected areas in southern states, and even a few high-growth inland areas that saw a tremendous ramp up during the early to mid-2000s such as Idaho.

The last ten seconds of the video shows a contra trend, practically wiping out growth area by area in the same manner that it appeared ten years prior. Corresponding to the quote above regarding the impetus for the current migration in recent years, you see 3+ percent growth in North Dakota as well as the current popularity of Texas. Another very interesting shift is from the north western, Reno area of Nevada to the north eastern area of the same state. What was driving that growth?

At the risk of sounding a bit like Pudd’nhead Wilson for pouring over such things, additional data sets and customizable maps for metropolitan and micropolitan statistical areas can be found here, the interactive map here.